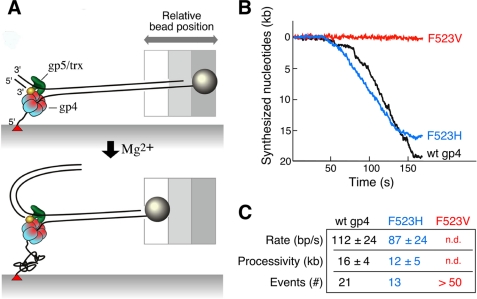
FIGURE 6.
Single-molecule analysis of strand-displacement synthesis. A, λ dsDNA (48.5 kb) is attached to the surface of the flow cell via one of the 5′-ends of the fork using biotin-streptavidin interaction, the 3′-end of the same strand is attached to a paramagnetic bead using digoxigenin-antidigoxigenin interaction. T7 DNA polymerase/thioredoxin (gp5/trx) and gp4 are preassembled at the replication fork in the presence of dNTPs but in the absence of Mg2+. The reaction is started by the addition of MgCl2 and dNTPs. The positions of the beads are recorded and analyzed as described under “Experimental Procedures.” B, examples of single molecule trajectories for leading strand synthesis are shown. Rate and processivity were calculated by fitting the distributions of individual single-molecule trajectories using Gaussian and exponential decay distributions, respectively. C, rate and processivity measurements of leading strand synthesis associated with wild-type or altered gp4. Values represent the mean ± S.E. Twenty-one events were used to calculate the rate and processivity for gp5/trx and wild-type gp4, 13 events for gp5/trx and gp4-F523H. More than 50 events were analyzed for gp5/trx and gp4-F523V mediated leading strand synthesis, but the rate and processivity could not be determined (n.d.).

