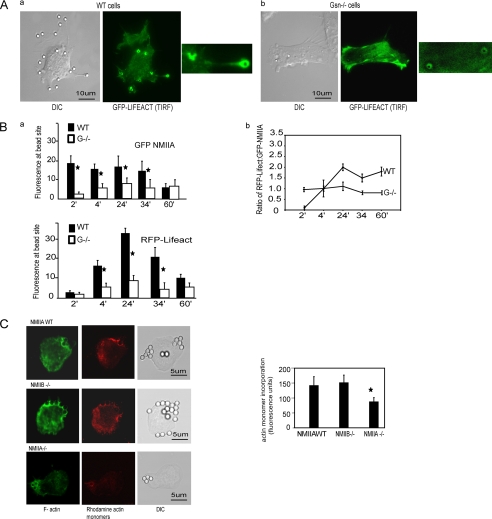
FIGURE 2.
A, recruitment of F-actin (GFP-Lifeact) to bead binding sites imaged by TIRF microscopy in living gelsolin WT (a) and gelsolin null cells (b). Insets show fluorescence at the collagen-coated bead sites in gelsolin WT and null cells. DIC, differential interference contrast. B, a, WT and gelsolin null cells were co-transfected with RFP-Lifeact and GFP-NMIIA. Images were taken on live cells over 60 min. Histograms show mean fluorescence ± S.E. from regions of interest (3-μm diameter circles) around individual bead sites obtained from the images of 30 different cells at each time point. b, line graph shows the mean ± S.E. of the ratios of RFP-Lifeact to GFP-NMIIA fluorescence from around beads in 30 different cells for each time point. C, representative images of NMIIA WT, NMIIA B null, and NMIIA null cells showing the incorporation of rhodamine-labeled actin monomers in permeabilized cells to estimate free barbed ends. Cells were stained with Alexa 488 phalloidin to show F-actin. Histogram shows means ± S.E. of rhodamine fluorescence from 50 cells for each condition.

