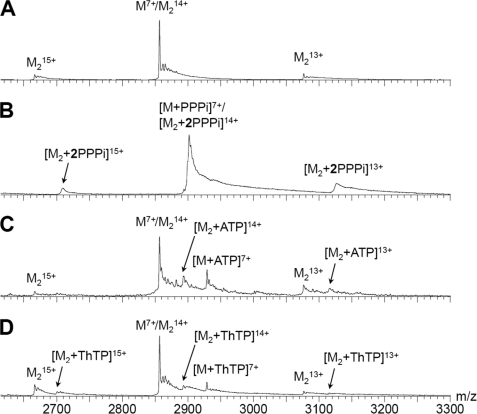
FIGURE 7.
Mass spectra showing high specificity of NeuTTM for PPPi compared with ATP and ThTP. A, shown is a spectrum of 10 μm protein alone in 100 mm NH4OAc, pH 6.5. B, conditions were as in A but with 25 μm PPPi. C, conditions were as in A but with 20 μm protein and 50 μm ATP. D, conditions were as in A with 25 μm ThTP instead of PPPi. M, monomer; M2, dimer.

