FIGURE 1.
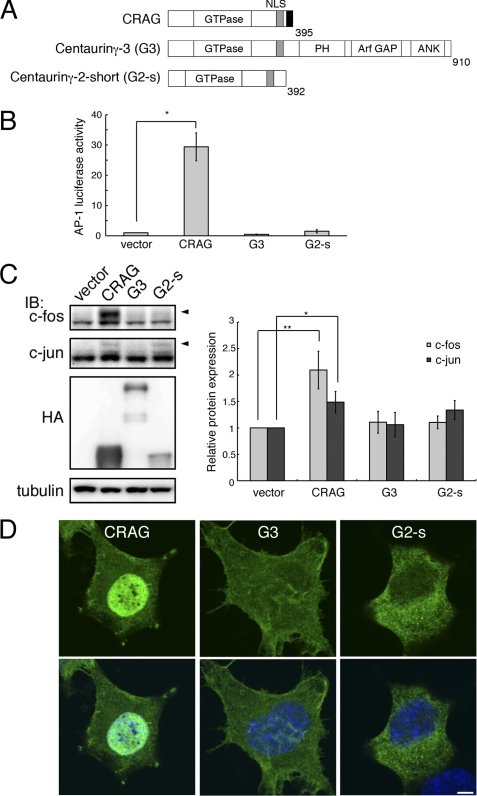
CRAG induces AP-1 activity. A, structural comparison of CRAG with centaurin-γ3/AGAP3 (G3) and centaurin-γ2/AGAP1 short form (G2-s). NLS, nuclear localization signal; ANK, ankyrin repeat; PH, pleckstrin homology domain. B, CRAG activates AP-1. Neuro2A cells were transfected with both pAP-1-Luc and pRL-CMV together with either empty expression vector or indicated vector. Luciferase activities were assessed 48 h after the transfection. Error bars indicate ±S.D. (n = 3). *, p < 0.05 (Student's t test). C, CRAG induces c-Fos activation. Lysates of Neuro2A cells as described above were immunoblotted with the indicated antibodies. Arrowheads indicate the positions of phosphorylated c-Fos and c-Jun. The protein levels of c-Fos and c-Jun normalized with tubulin are shown in the right panel when the control value was arbitrarily set 1.0. Error bars indicate ±S.D. (n = 4). *, p < 0.05; **, p < 0.01. D, subcellular localizations of CRAG, G3, and G2-s. Neuro2A cells transfected with either the empty vector, HA-CRAG, HA-G3, or HA-G2-s were immunostained with anti-HA (green) and Hoechst 33258 (blue). Scale bar, 5 μm.

