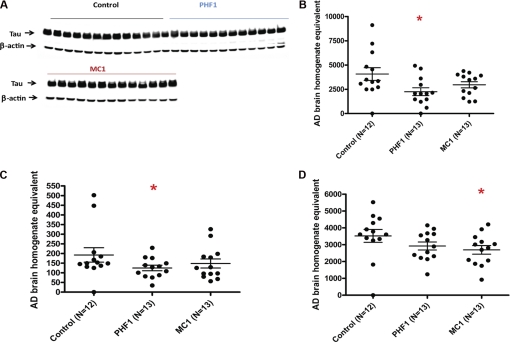
FIGURE 9.
Biochemical analysis of P301S extracts. A, HT7 Western blot of total Tau in total extracts shows no apparent differences between treatment groups. B–D, AT8 ELISA of P301S mice. All plots show AT8 signal (micrograms of AD brain homogenate that would produce the same ELISA signal) per milligram of mouse tissue homogenate. B, P1 brain fraction shows a significant reduction in AT8 signal for PHF1 and a trend toward reduction for MC1 compared with control antibody. C, S1 brain fraction shows a significant reduction in AT8 signal for PHF1 and a trend toward reduction for MC1 compared with control antibody. Note that the AT8 signal in the soluble fraction is <10% of the P1 signal. D, P1 spinal cord fraction shows a significant reduction in AT8 signal for MC1 and a trend toward reduction for PHF1 compared with control antibody.

