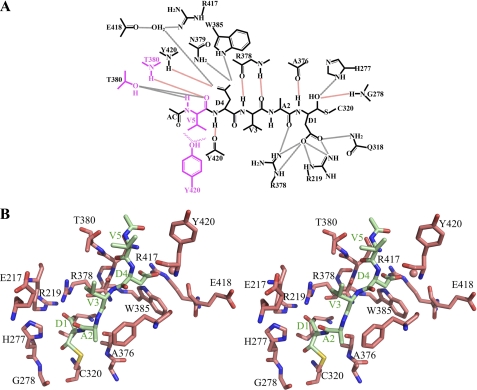
FIGURE 2.
Caspase-2 interactions with peptide inhibitors. A, schematic diagram emphasizing protein/inhibitor contacts for caspase-2·VDVAD-CHO. Backbone hydrogen bonds are shown in black dotted lines, main chain hydrogen bonds are shown in red dotted lines, and hydrophobic interactions are shown in wavy lines. The P5 residue and its interacting residues are shown in magenta. Analogous diagrams for three other caspase-2·inhibitor structures are shown in supplemental Fig. S3. B, stereo image of the substrate-binding groove in the complex of casp2·VDVAD. Caspase-2 is shown in salmon; Ac-VDVAD-CHO is shown in light green.

