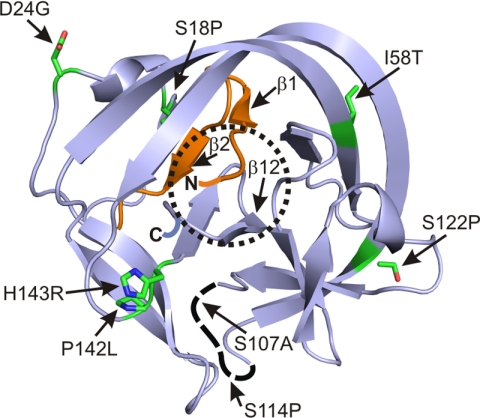
FIGURE 4.
Structural presentation of the locations of mutations in the improved inteins. The ribbon structure is adapted from the crystal structure of the Ssp DnaB mini-intein (42) (Protein Data Bank no. 1MI8). The N and C termini are indicated by N and C. Mutated residues in the intein are shown as stick presentation. The active site is indicated by the dotted circle.

