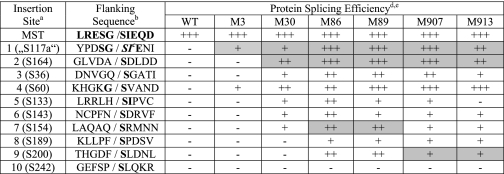
TABLE 1.
Splicing efficiencies of the Ssp DnaB wild type and improved inteins
a Sites 1–10 are insertion sites in the KanR gene.
b Native extein residues are shown in bold.
c SI are additional residues added to APH(3′)-I.
d Splicing efficiency is: −, <5%; +, 10–50%; ++, 51–80%; +++, >80%.
e Highlighted boxes indicate the insertion sites at which each improved intein was evolved through directed evolution.

