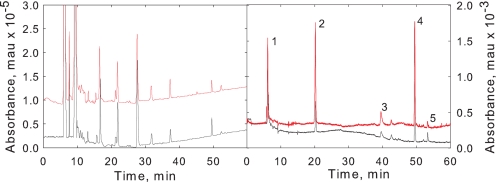
FIGURE 3.
HPLC chromatogram of tryptic peptides of FLNH2-derivatized TM proteins. Peptides from oxidized proteins are in red and the control non-oxidized proteins are black. Left panel: elution profile monitored at 220 nm associated with peptide absorbance. Right panel, elution profile monitored at 440 nm associated with FLNH2 absorbance.

