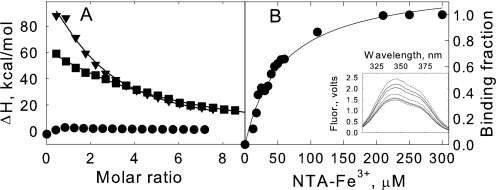
FIGURE 5.
Iron binding of truncated SO2907 protein. Panel A, ITC measurement of NTA-Fe3+ binding to TonB-A (circles), TonB-B (inverted triangles), and TonB-B (Y800F) (squares) at pH 7.5 (50 mm HEPES, 100 mm NaCl) and 25 °C. Titration plots were derived from the integrated heats of binding, corrected for heats of dilution. The black line represents the best non-linear fit to the data assuming a single-set binding model. Panel B, the inset shows fluorescence spectra of TonB-B and the quenching by additions of NTA-Fe3+. Spectra were obtained on a 20 μm solution of TonB-B. Both proteins and ligand samples were prepared in 50 mm HEPES, pH 7.4 and 100 mm NaCl. The bind curve was generated from analysis of the fluorescence quenching measurements following the method of Winzor (31). Apparent binding affinity is summarized in the text.

