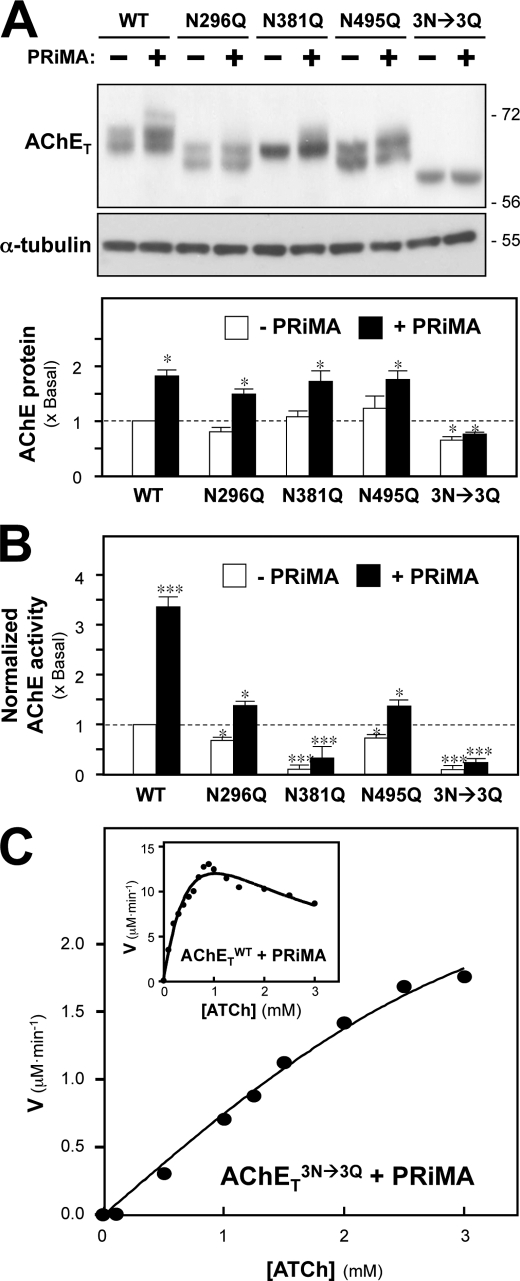
FIGURE 2.
N-Glycosylation of AChET affects the production of catalytic activity. A, HEK293T cells were transfected with cDNAs encoding AChETWT, AChETN296Q, AChETN381Q, AChETN495Q, and AChETN296Q/N381Q/N495Q with or without PRiMA. The proteins were analyzed as in Fig. 1C. α-Tubulin (∼55 kDa) served as a loading control. The lower panel shows quantitation of AChET protein from the blots by calibrated densitometry. B, AChE enzymatic activity in the transfected cells from A was determined by the Ellman assay. The data are normalized to the amount of AChET protein and are expressed as the ratio to the value obtained for cells expressing AChETWT alone, which is arbitrarily set to 1. A similar profile was achieved if the enzymatic activity was normalized to total protein (not shown for clarity). C, AChETWT and PRiMA (inset) or AChETN296Q/N381Q/N495Q and PRiMA co-expressed cell lysates were subjected to Ellman assay using different concentrations of ATCh substrate. The reaction velocity (V) was calculated at each concentration of substrate. Representative profiles from six independent experiments are shown. Values are the means ± S.E. obtained in four independent experiments (n = 4), each with triplicate samples. *, p < 0.05; ***, p < 0.001 compared with AChETWT alone control.

