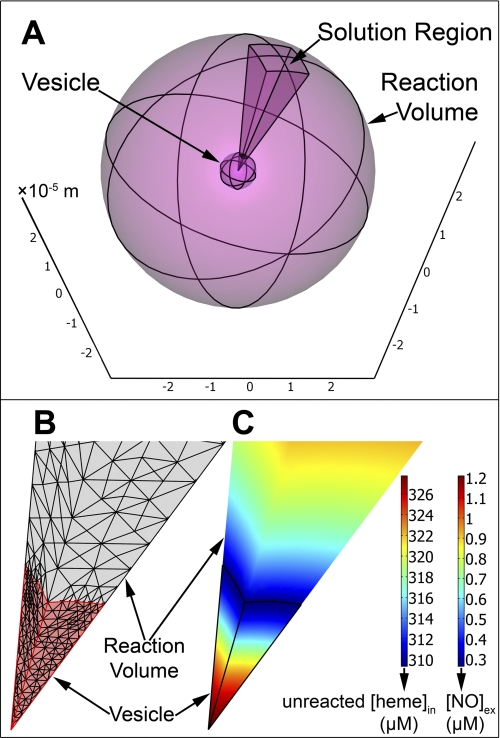
FIGURE 1.
Three-dimensional model of NO uptake by phospholipid vesicles. A, the two-sphere model of a stopped-flow experiment between NO and 0.62 mm deoxygenated hemoglobin encapsulated within a phospholipid vesicle with a diameter of 8000 nm. The radius of the large outer sphere represents the half-distance between the centers of any two vesicles in a real experiment. The axes are marked in units of 10−5 meters. On this scale the vesicle diameter is 0.8 × 10⁻⁵ m and the outer sphere diameter is 6 × 10⁻⁵ m. The 20 × 20 degree square cone is the region over which we have solved our system of equations. B, a zoom-in to the finite element mesh of the cone solution region shown in A. The vesicle domain is the bottom section colored in pink and part of the extracellular volume domain is the gray section above. The border between the vesicle domain and the extracellular volume domain is the membrane of the vesicle. Each straight edge of the vesicle domain is the 4000-nm vesicle radius. C, the simulated concentrations in micromolar of unreacted hemoglobin inside the vesicle and NO in the extracellular space (Reaction Volume) at the half-life of the reaction. The domains are displayed with the same zoom as in panel B and the vesicle domain is outlined in black. The same color code is applied to both domains, but maps the concentration of unreacted hemoglobin inside the vesicle ([heme]in) and NO outside of the vesicle ([NO]ex).

