FIGURE 3.
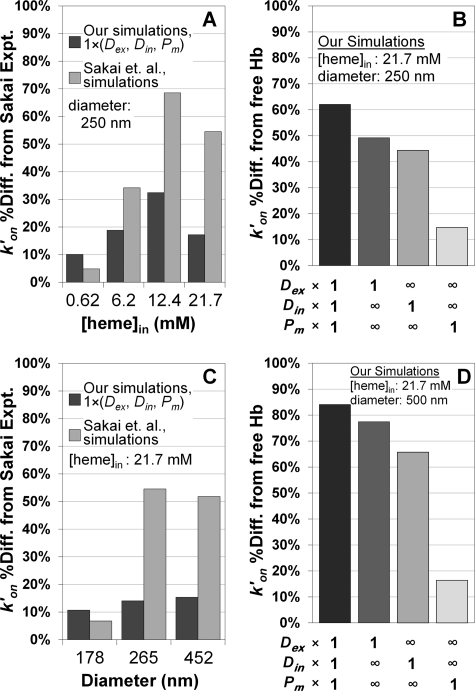
Comparisons of bimolecular rate constants for NO uptake by phospholipid vesicles. A, the percent difference between experimentally obtained rate constants by Sakai et al. (21) and simulated rate constants plotted versus intracellular Hb concentration from the data in Fig. 2A (250 nm vesicle diameter). A multiplication factor of 1 in the legend for extracellular diffusion of NO (Dex), intracellular diffusion of NO and Hb (Din), and membrane permeability of NO (Pm) indicates that the physiological values of these parameters were used in our simulations (Table 1). B, the percent difference between the cell-free Hb uptake rate constant of NO and our simulated rate constants for a vesicle of 250 nm in diameter and with 21.7 mm intracellular hemoglobin from Fig. 2B. Employed parameter values for extra (Dex) and intracellular diffusion (Din) and membrane permeability (Pm) are indicated below the x axis. A multiplication factor of 1 refers to the physiological value presented in Table 1 and the infinity symbol signifies the effectively infinite parameter value from Table 1. C, percent difference between simulated rate constants and the experimentally measured rate constants of Sakai et al. (21) from the data of Fig. 2C (intracellular hemoglobin concentration of 21.7 mm) plotted versus vesicle diameter. Our simulated data and that of the other authors were extrapolated with a third degree polynomial to the average vesicle diameters (x axis) in the experiments of the other authors. D, percent difference between the NO uptake rate of cell-free Hb and our simulated NO uptake rate constants for a vesicle of 500 nm in diameter and with 21.7 mm intracellular Hb plotted, analogous to data in panel B, from the data in Fig. 2D. Parameter values in each simulation are indicated below the x axis.

