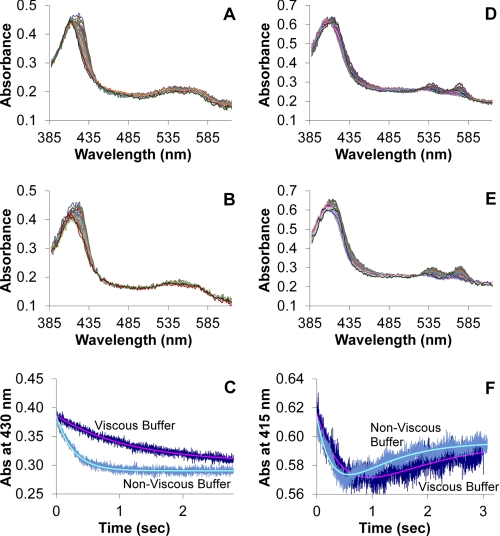
FIGURE 5.
Stopped-flow absorption of red blood cells in viscous and nonviscous buffer. Red blood cells were diluted into NO-containing buffer and absorption spectra were collected as a function of time. A, a subset of absorption spectra collected every millisecond is shown after a mixture in nonviscous buffer under anaerobic conditions. The final mixture contained Hb at 50 μm and NO at 200 μm. The data show NO binding to deoxygenated Hb and analysis yielded an observed rate constant of 3.7 1/s. B, a subset of absorption spectra collected every millisecond is shown after a mixture in viscous buffer under anerobic conditions. The final mixture contained Hb at 50 μm and NO at 200 μm. The data show NO binding to deoxygenated Hb and analysis yielded an observed rate constant of 0.86 1/s. C, the kinetics of the absorption at 430 nm are shown for both viscous and nonviscous buffers for data collected under anaerobic conditions. Both the raw data (noisy) and the fits from singular value decomposition and global analysis are shown. D, a subset of absorption spectra collected every millisecond is shown after a mixture in nonviscous buffer under aerobic conditions. The final mixture contained Hb at 59 μm and NO at 180 μm. The data show NO reacting with oxygenated Hb to form MetHb with subsequent NO binding to the MetHb and analysis yielded an observed rate constant of 3.1 1/s for the initial reaction. E, a subset of absorption spectra collected every millisecond are shown after a mixture in viscous buffer under aerobic conditions. The final mixture contained Hb at 64 μm and NO at 190 μm. The data show NO reacting with oxygenated Hb to form MetHb with subsequent NO binding to the MetHb and analysis yielded an observed rate constant of 1.5 1/s for the initial reaction. F, the kinetics of the absorption at 415 nm are shown for both viscous and nonviscous buffers for data collected under aerobic conditions. Both the raw data (noisy) and fit from singular value decomposition and global analysis are shown.

