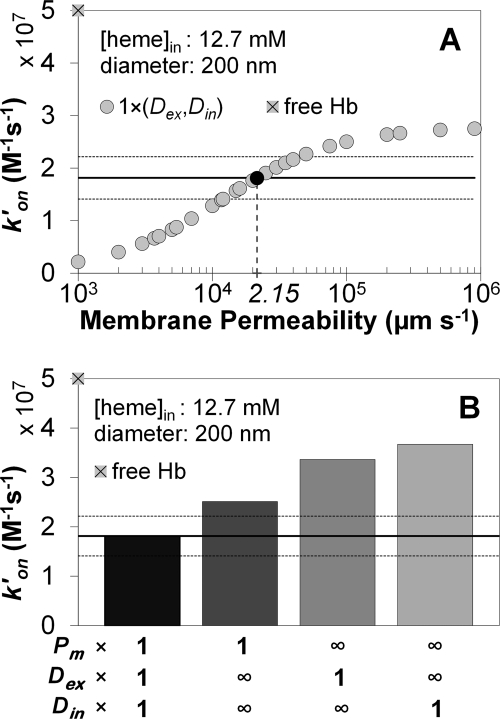
FIGURE 6.
Computer simulations of the apparent bimolecular rate constants for NO uptake by oxygenated red blood cell microparticles. A, our simulated bimolecular rate constant is plotted for 26 different values of membrane permeability to NO (x axis). As indicated in the legend with a multiplication factor of 1, extracellular diffusion of NO (Dex) as well as intracellular diffusion of NO and Hb (Din) were set to the physiological values from Table 2. The rate constant for NO uptake by a solution of freely dissolved oxygenated Hb is shown on the y axis as a gray square with a black cross. The experimentally measured bimolecular rate constant (1.81 ± 0.40 × 10⁷ m−1 s−1) appears as a horizontal black line (in all panels) and its standard deviation as two dotted horizontal black lines. The simulated rate constant that is the same as that obtained experimentally is shown as a black circle, the corresponding membrane permeability is indicated on the x axis below. B, effect of membrane permeability determined in panel A (2.15 × 104 μm s−1) compared with diffusion effects in limiting the NO uptake rate. Four simulated rate constants are shown as bars. The left-most represents the same simulation as the black circle in panel A, where extra (Dex) and intracellular (Din) diffusion were set to the physiological values given in Table 2 and membrane permeability was set to the value determined in panel A, as indicated with a multiplication factor of 1 for all of these parameters below the x axis. In each of the remaining three simulations the parameter with a multiplication factor of 1 (as indicated below the x axis) was set to its physiological value, whereas the other two were effectively infinite (indicated by the infinity symbols).

