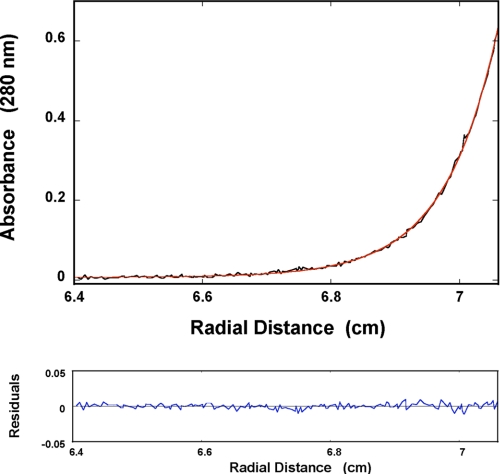
FIGURE 2.
Sedimentation equilibrium concentration profile of the DENV polymerase in buffer T5 (pH 7.6, 10 °C), containing 1 mm MgCl2. The concentration of the protein is 1.41 × 10⁻⁶ m (monomer). The profile has been recorded at 280 nm and at 12,000 rpm. The solid red line is the nonlinear least squares fit to a single exponential function (Equation 4), with a single species having a molecular weight of 101,000 ± 6000. The bottom panel shows the residuals of the fit.

