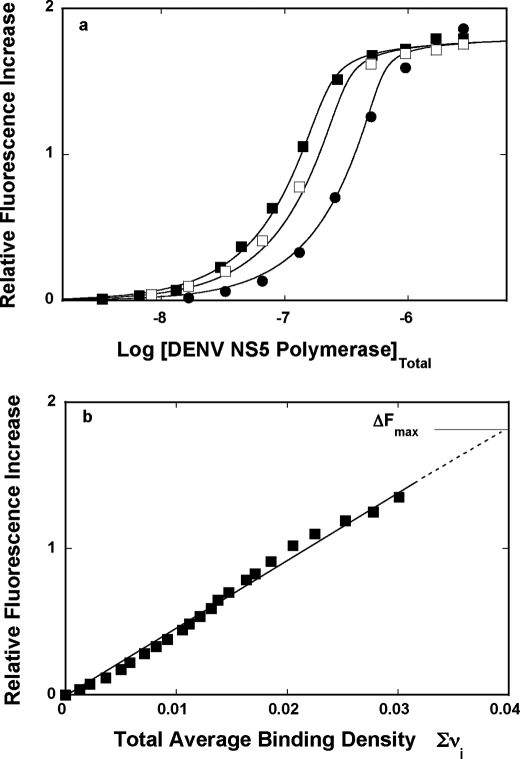
FIGURE 4.
a, fluorescence titrations of the poly(ϵA) with the DENV polymerase (λex = 325 nm, λem = 410 nm) in buffer T5 (pH 7.6, 10 °C) at three different nucleic acid concentrations: 5.99 × 10⁻⁶ m (■), 8.55 × 10⁻⁶ m (□), and 1.71 × 10⁻⁵ m (nucleotide) (●). The solid lines are nonlinear least squares fits of the titration curves, using the generalized McGhee-von Hippel isotherm, described by Equations 8–9 with the intrinsic binding constant, K = 4 × 10⁶ m−1, cooperative interactions parameter, ω = 17, and maximum fluorescence increase, ΔFmax = 1.81. b, dependence of the relative fluorescence increase, ΔFobs, of poly(ϵA) upon the total average binding density, Σvi of the DENV polymerase (■). The solid line follows the experimental points and has no theoretical basis. The dashed line is the extrapolation of ΔFobs to its maximum value, ΔFmax = 1.81.

