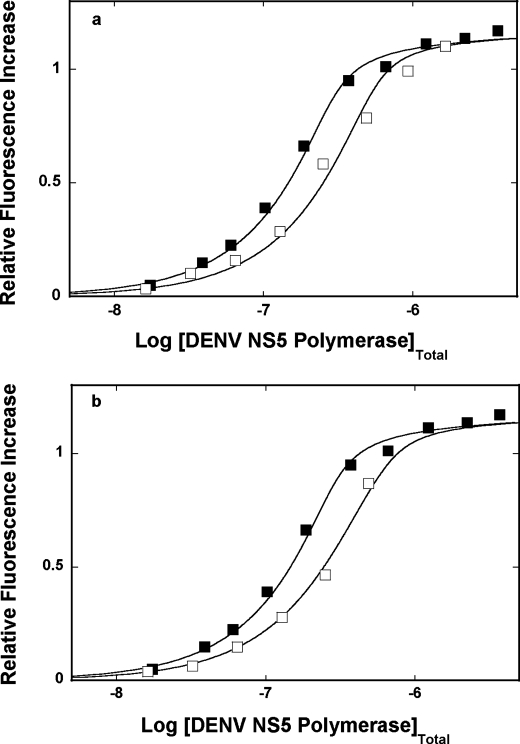
FIGURE 8.
a, fluorescence titrations of poly(ϵA) with the DENV polymerase (λex = 325 nm, λex = 410 nm) in buffer T5 (pH 7. 6, 10 °C), containing 1 mm MgCl2, in the absence (■) and presence of the ssRNA homopolymer, of poly(C) (□). The concentration of poly(ϵA) is 9.41 × 10⁻⁶ m (nucleotide). The concentration of poly(C) is 1.34 × 10⁻⁵ m (nucleotide). The solid lines are nonlinear least squares fits of the binding titration curves, using Equations 8–14, with K = 2.5 × 10⁶ m−1, ω = 14, and ΔFmax = 1.19 for poly(ϵA), and KS = 3 × 10⁶ m−1 and ωS = 1 for poly(C). b, fluorescence titrations of poly(ϵA) with the DENV polymerase (λex = 325 nm, λem = 410 nm) in buffer T5 (pH 7.6, 10 °C), containing 1 mm MgCl2, in the absence (■) and presence of the ssRNA homopolymer, of poly(U) (□). The concentration of poly(ϵA) is 9.41 × 10⁻⁶ m (nucleotide). The concentration of poly(U) is 1.92 × 10⁻⁵ m (nucleotide). The solid lines are nonlinear least squares fits of the binding titration curves, using Equations 8, 9, and 12–14, with the binding and spectroscopic parameters for poly(ϵA) as in a and KS = 9 × 10⁵ m−1 and ωS = 1, for poly(U).

