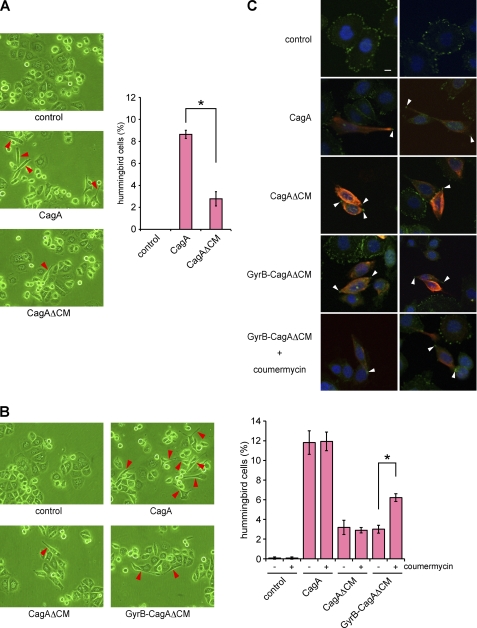
FIGURE 5.
Induction of hummingbird phenotype by monomeric and dimeric CagA proteins. A, AGS cells were transfected with a CagA or CagAΔCM vector, and cell morphology was observed by light microscopy at 17 h after transfection. Red arrows indicate hummingbird phenotype induced by CagA (left). The number of hummingbird cells was counted. Error bars, ±S.D. (n = 3), *, p < 0.01, Student's t test (right). B, AGS cells were transfected with a CagA, CagAΔCM, or GyrB-CagAΔCM vector. At 8 h after transfection, coumermycin was added to the culture, and cells were incubated for an additional 9 h before harvest. Cell morphology was analyzed by light microscopy. Red arrows indicate hummingbird cells induced by CagA (left). The number of hummingbird cells was counted. Error bars, ±S.D. (n = 3), *, p < 0.01, Student's t test (right). C, cells were co-stained with anti-active FAK (pY576) (green) and anti-HA (red) antibodies. Nuclei were visualized by DAPI staining (blue). Confocal x-y images are shown. White arrows indicate distal ends of membrane protrusions in cells with the hummingbird phenotype. Scale bar, 10 μm.

