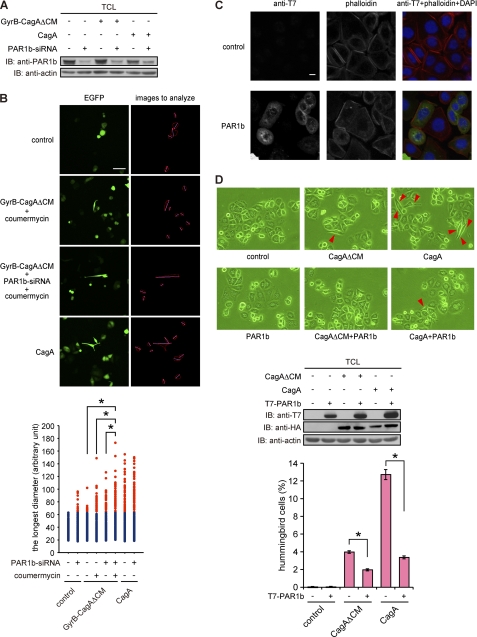
FIGURE 7.
Effect of PAR1 inhibition on the hummingbird phenotype. A, AGS cells treated with PAR1b-specific siRNA for 24 h were transfected with a CagA or GyrB-CagAΔCM vector. At 17 h after vector transfection, lysates were prepared and were subjected to immunoblotting (IB) with the indicated antibodies. B, AGS cells transfected with PAR1b-specific siRNA for 24 h were co-transfected with CagA or GyrB-CagAΔCM and EGFP vectors. At 8 h after transfection, coumermycin was added to the culture, and cells were incubated for an additional 9 h before analysis. Cell morphology was observed by using a fluorescence microscope (upper). Scale bar, 100 μm. Lower, the longest diameters of cells expressing CagA or GyrB-CagAΔCM, which were calculated from images presented in upper right panels are shown. Red dots show cells that are longer than the maximum value of control cells. n = 200, *, p < 0.01, Mann-Whitney U test (lower). C, AGS cells were transfected with a PAR1b expression vector. At 17 h after transfection, cell morphology was observed by staining cells with an anti-T7 antibody (green), phalloidin (red), or DAPI (blue). Scale bar, 10 μm. D, AGS cells were transfected with a PAR1b expression vector with or without a CagA or CagAΔCM vector. At 17 h after transfection, cell morphology was observed by light microscopy. Red arrows indicate hummingbird phenotype induced by CagA (upper). TCLs were prepared and were subjected to immunoblotting with the indicated antibodies (middle). Lower, the number of hummingbird cells was counted. Error bars, ±S.D. (n = 3), *, p < 0.01, Student's t test.

