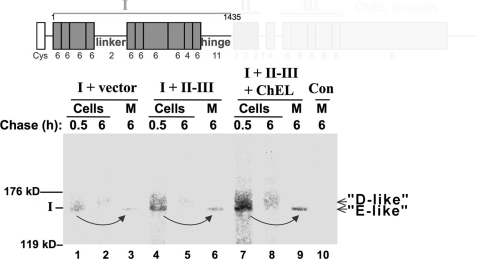
FIGURE 3.
Oxidative maturation of Tg region I. Above the data, the schematic diagram shows the region I construct (Tg-A1435X) used in this experiment. In the experiment, 293 cells were either untransfected controls (Con) or transfected either with Tg region I or region I plus secretory II-III ± secretory ChEL. The cells were pulse-labeled for 15 min with 35S-amino acids and chased in complete medium for the times indicated. Cell lysates (Cells) and chase media (M) were then collected before immunoprecipitation with anti-Tg, deglycosylation with PNGase F, and analysis by nonreducing SDS-PAGE and fluorography. The positions of the 119- and 176-kDa molecular mass markers are indicated.

