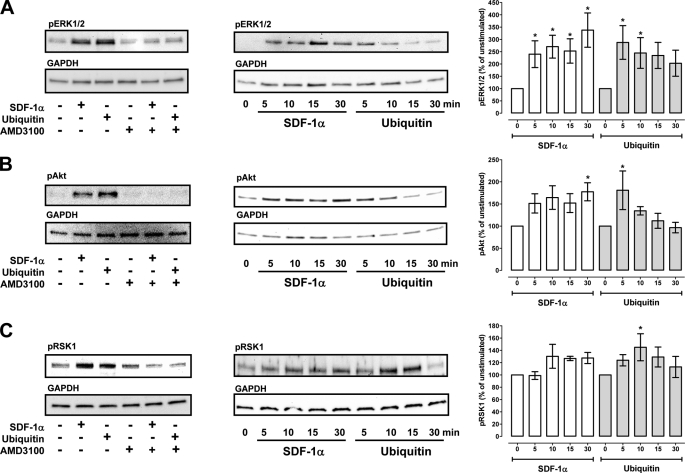
FIGURE 3.
CXCR4-induced protein kinase phosphorylation. Western blot analyses of MAPK phosphorylation after stimulation of THP-1 cells with ubiquitin and SDF-1α. A, phospho-ERK1/2. B, phospho-Akt. C, phospho-RSK1. Left panels, cells were pretreated with or without AMD3100 and stimulated with 1 μm ubiquitin or SDF-1α for 10 min at 37 °C. Center panels, time course of MAPK phosphorylations after stimulation of cells with 1 μm ubiquitin or SDF-1α. Right panels, quantification of the chemiluminescence signals after cell stimulation as in B. White bars, SDF-1α stimulation. Gray bars, ubiquitin stimulation, n = 5–10. *, p < 0.05 versus unstimulated cells.

