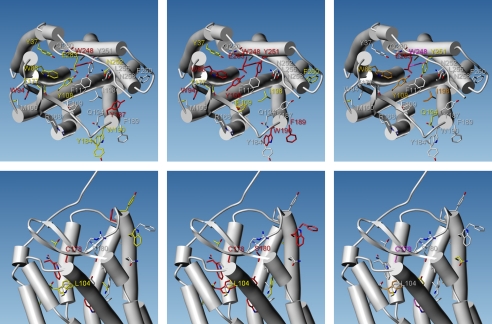
FIGURE 4.
Effects of CCR5 single mutations on CCL3 (left), gp120 (middle), and MVC (right) binding to the receptor. As in Fig. 3, the 7TM of CCR5 are represented by cylinders, as viewed from the extracellular side of the receptor (top) or in the plane of the plasma membrane (bottom). The side chains of mutated residues are displayed as capped sticks. Atoms are colored as follows: oxygen in red, nitrogen in blue, sulfur in pale yellow, carbon using a white-yellow-red color scale depending on the strength of radioligand binding inhibition (white denotes unchanged binding upon mutation, and red indicates that binding is lost). No accurate measurements could be reported for residues colored in magenta.

