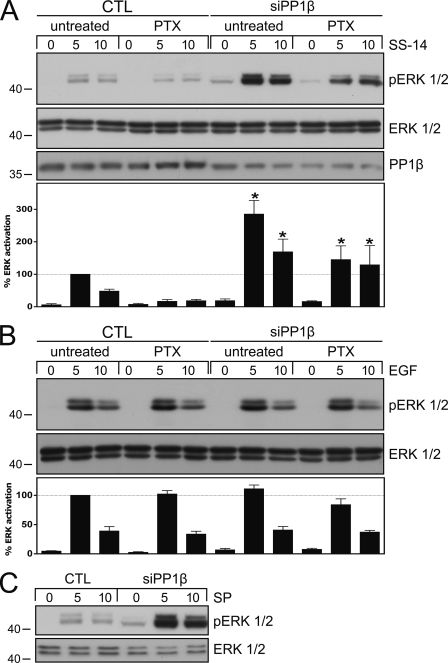
FIGURE 6.
Inhibition of sst2A dephosphorylation results in enhanced and prolonged ERK activation. A, HEK293 cells stably expressing the rat sst2A receptor were transfected with PP1β siRNA or a nonsilencing RNA (CTL) for 72 h. Where indicated, cells were incubated with 100 ng/ml pertussis toxin (PTX) 16 h before agonist exposure. Cells were then exposed to 1 μm SS-14 for 0, 5, or 10 min. The levels of phosphorylated ERK1/2 and total ERK1/2 were then determined by Western blot analysis. siRNA knockdown was confirmed using a PP1β antibody. Bands were quantified and expressed as percent ERK activation induced by SS-14 exposure for 5 min in CTL-transfected cells (dotted line). Data correspond to the mean ± S.E. (error bars) from four independent experiments performed in duplicate. Results were analyzed by one-way ANOVA followed by the Bonferroni post-test (*, p < 0.05). B, HEK293 cells stably expressing the rat sst2A receptor were transfected with PP1β siRNA or a nonsilencing RNA (CTL) for 72 h. Where indicated, cells were incubated with 100 ng/ml pertussis toxin (PTX) 16 h before agonist exposure. Cells were then exposed to 1 ng/ml EGF for 0, 5, or 10 min. The levels of phosphorylated ERK1/2 and total ERK1/2 were then determined by Western blot analysis. Bands were quantified and expressed as percent ERK activation induced by EGF exposure for 5 min in CTL-transfected cells (dotted line). Data correspond to the mean ± S.E. from three independent experiments performed in duplicate. C, HEK293 cells stably expressing the rat NK1receptor were transfected with PP1β siRNA or a nonsilencing RNA (CTL) for 72 h. Cells were then exposed to 1 μm substance P (SP) for 0, 5, or 10 min. The levels of phosphorylated ERK1/2 and total ERK1/2 were then determined by Western blot analysis. The experiment was repeated three times. Note that inhibition of PP1β expression resulted in an aberrantly enhanced and prolonged ERK activation in SS-14- and substance P- but not in EGF-treated cells. The positions of molecular mass markers are indicated on the left (in kDa).

