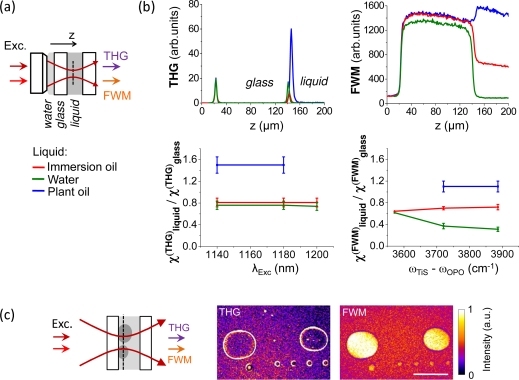
Fig. 3.
Effect of χ(3) on THG-FWM contrast. (a) z-scan geometry used for estimating χ(THG) and χ(FWM) of various liquids relative to glass. The focus of a coverslip-corrected objective is scanned through a water-glass and a glass-liquid interface. (b) Top, THG (left) and FWM (right) z-scan profiles for different liquids (immersion oil, water, plant oil). The displayed profiles are normalized to their values at the first interface. Bottom, estimated values of χ(THG) (left) and χ(FWM) (right) relative to glass (see text), for different OPO wavelengths and TiS-OPO frequency differences. Deviation of the water χ(FWM) curve near 3600cm−1 is due to the presence of CARS at this frequency shift. It can be seen that in all the conditions explored here. (c) Simultaneously recorded images of immersion oil droplets in water for λOPO = 1140nm and ωTiS – ωOPO = 3890cm−1. Water/immersion oil interfaces are visible in the THG images, and immersion oil produces a stronger FWM signal than water. Scale bar: 50μm.

