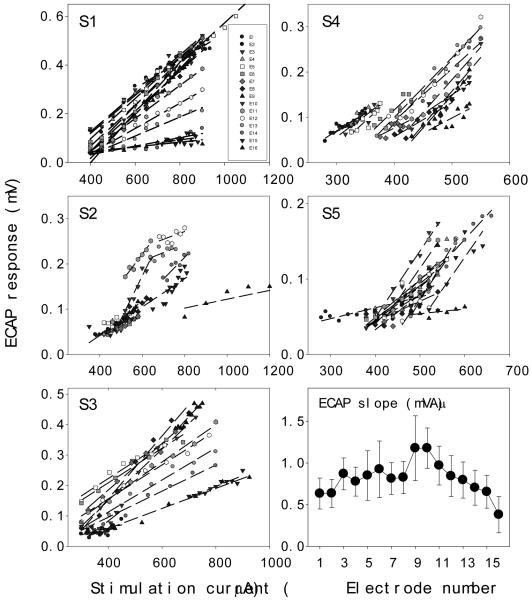
Figure 6.
ECAP growth functions for all electrodes (different symbols) in 5 subjects (individual panels labeled by S1-S5). Dashed lines are the best fit to the ECAP data. The bottom-right panel shows the mean ECAP slope (circles) and its standard error (error bars) as a function of masker electrode in the cochlea.

