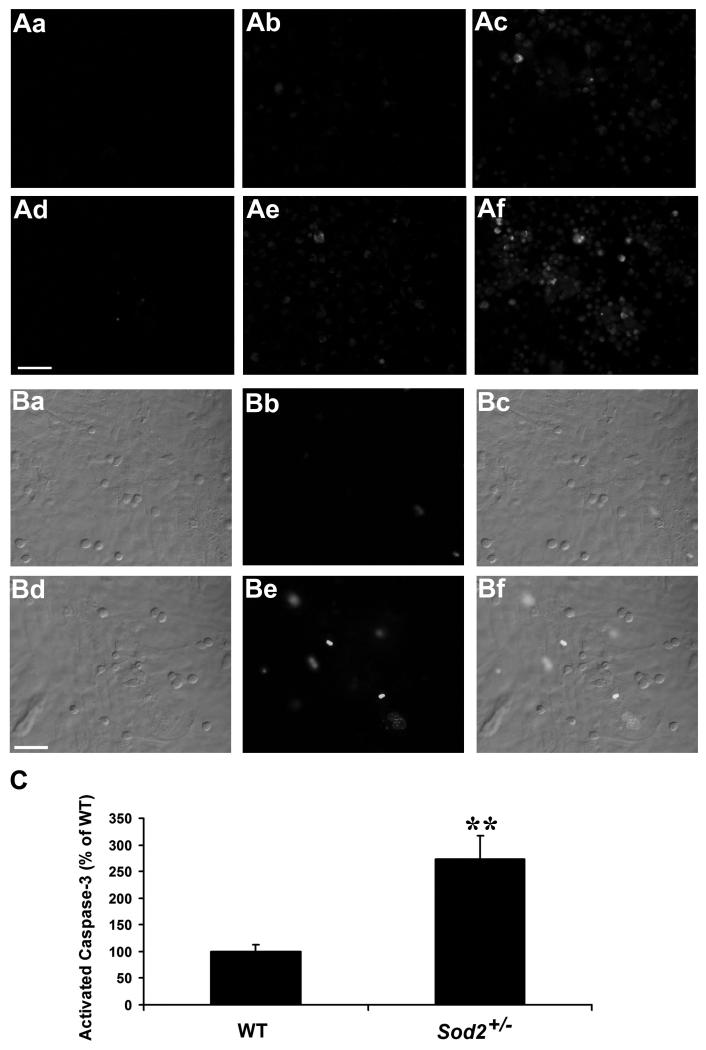
Figure 6. Decreased expression of SOD2 increases mononuclear phagocyte-induced activation of caspases.
(A) In situ staining of activated caspases in WT (Aa-Ac) and Sod2+/− (Ad-Af) RPE cells. Fluorescence images of cells stained with FITC-VAD-fmk to localize activated caspases in RPE cells alone (Aa, Ad), RPE cells co-cultured with unstimulated mononuclear phagocytes (Ab, Ae), or RPE cells co-cultured with IFN-γ-activated mononuclear phagocytes in the presence of IFN-γ (Ac, Af). (B) Differential interference contrast (DIC) and fluorescence images of activated caspase-3 in WT (Ba-Bc) and Sod2+/− (Bd-Bf) RPE cells co-cultured with IFN-γ-activated mononuclear phagocytes. (Bc) Merged image of WT RPE DIC (Ba) and activated caspase-3 fluorescence (Bb); (Bf) Merged image of Sod2+/− RPE DIC (Bd) and activated caspase-3 fluorescence (Be). (C) shows a quantification analysis of activated caspase-3 fluorescence intensity in WT and Sod2+/− RPE cells exposed to IFN-γ-activated mononuclear phagocytes. **P < 0.01, compared with WT. Scale bar, 50 μm.

