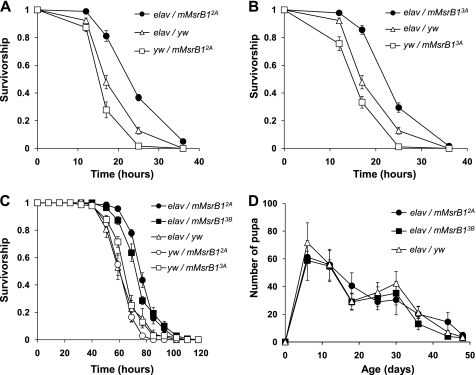
FIGURE 8.
Stress resistance and reproduction of mMsrB1-expressing flies. A and B, survivorship curves of mMsrB1-expressing flies on 30 mm dietary paraquat. 180 male flies (9 replicates of 20 animals) were tested for each genotype. Genotypes are shown on the plot. Data for each time point are reported as the means of survived animals in 9 replicates ± S.E. All trials were performed concurrently. C, starvation resistance of flies expressing mMsrB1 in the nervous system. 140 male flies (7 replicates of 20 animals) were tested for each genotype (shown on the plot). Data are reported as the means of survived animals in 7 replicates ± S.E. for each time point. All trials were performed concurrently. D, age-associated changes in pupa production. Changes in pupa production were determined from counts of pupa developed from eggs laid by five females during 24 h. The y axis represents the number of pupa produced by one female in one vial. 10 replica of each vial were tested. Genotypes are shown on the plot. Data are reported as mean of 10 replica ± S.D.

