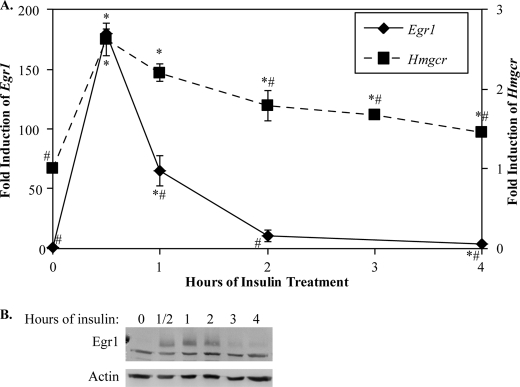
FIGURE 1.
Expression of Egr1 and Hmgcr is induced by insulin in H4IIE cells. The H4IIE insulin-sensitive rat hepatoma cell line was treated with 0.1 μm insulin for time points indicated on the x axis. In A, expression of Egr1 mRNA (left y axis) and Hmgcr pre-mRNA (right y axis) were assayed by RT-qPCR, as described under “Materials and Methods,” and normalized to the level of 18 S rRNA. These data show the average and S.D. of four independent experiments. Data points identified with asterisks indicate points statistically significant from untreated cells, and those identified with number signs are significantly different from the maximum expression at 30 min (p < 0.05, Welch's t test). B, shows an immunoblot of Egr1 protein levels during the insulin stimulation time course with an actin loading control. The lower band in the Egr1 immunoblot is a nonspecific band that did not change under any conditions tested; the upper band is Egr1.

