FIGURE 2.
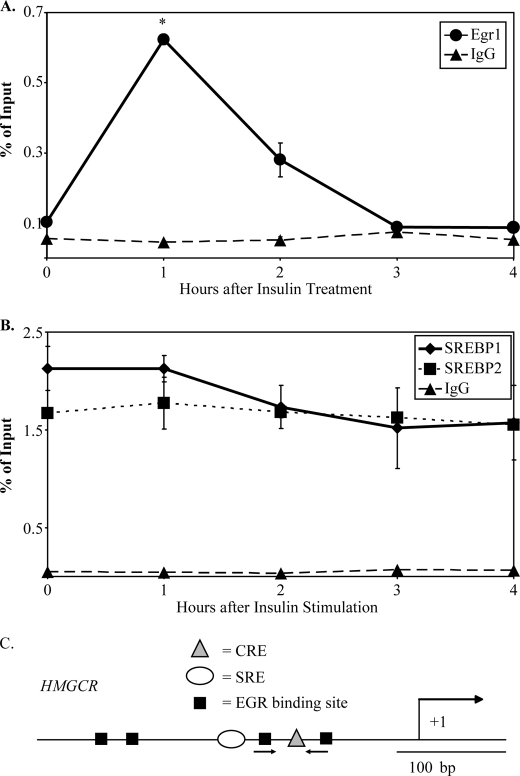
Localization of Egr1, but not SREBP-1 or SREBP-2, to the Hmgcr promoter is induced by insulin in H4IIE cells. H4IIE cells were treated with insulin for indicated time points and then processed for chromatin immunoprecipitation assays, as described under “Materials and Methods,” using antibodies against Egr1 and IgG (A) or SREBP-1, SREBP-2, and IgG (B). The percentage of recovery relative to input DNA was measured using qPCR with primers designed to detect putative EGR binding sites. Y axis values indicate average observations of two independent ChIP assays, and error bars represent S.D. Egr1 binding after 1 h of insulin was found to be statistically distinct from background Egr1 binding (asterisks indicate p < 0.05, Welch's t test). C, a diagram of the Hmgcr promoter shows the characterized cAMP-response element (CRE) and sterol response-element (SRE) indicated as well as putative EGR binding sites. The location of the primers used for ChIP analysis is indicated with arrows.

