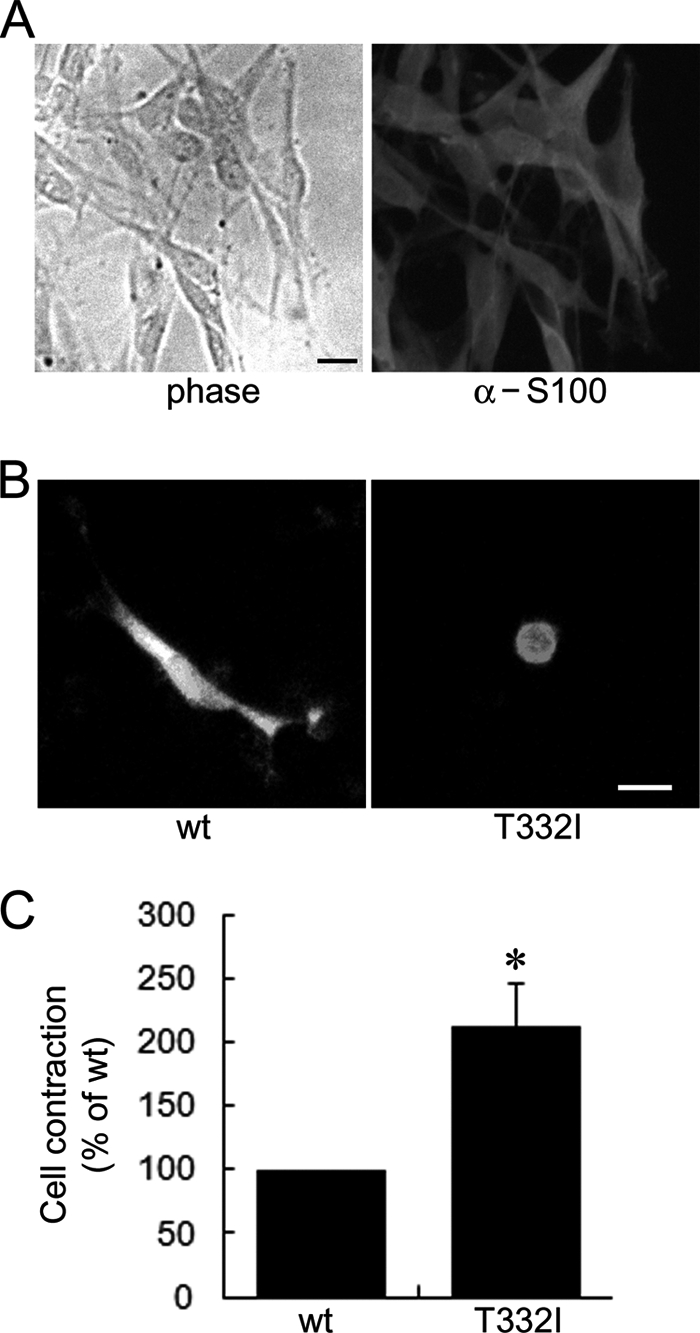
FIGURE 7.

Cell contraction induced by ARHGEF10 T332I in Schwann cells. A, left, phase contrast image of Schwann cells derived from rat sciatic nerves. Right, Schwann cells fixed and stained with anti-S100 antibody. Scale bar, 10 μm. B, Schwann cells transiently transfected with the plasmid encoding GFP-ARHGEF10 wt or T332I. After 48 h, fluorescence images of living cells were observed. Scale bar, 10 μm. C, quantitative analysis of cell contraction of Schwann cells. Schwann cells were transiently transfected with the plasmid encoding GFP-ARHGEF10 wt or T332I. The proportion of cell contraction was scored as a percentage of the rounded cells of GFP-positive cells, and values are expressed as -fold change compared with wt. Cells floating in the culture medium were excluded from counting. The data represent the mean ± S.E. (error bars) from three independent experiments. *, p < 0.05. For each experiment, >30 cells were counted.
