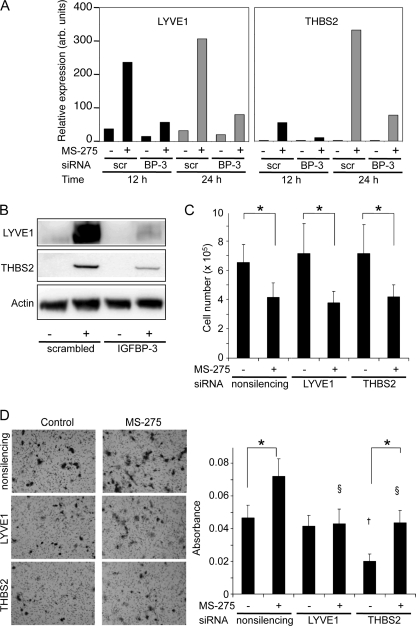
FIGURE 6.
Effect of LYVE1 and THBS2 silencing on HepG2 cells. 24 h after transfection with control or IGFBP-3 siRNA, cells were changed to fresh medium ± 6 μm MS-275 for an additional 24 h. LYVE1 and THBS2 mRNA were analyzed in triplicate by real time qRT-PCR (A) and protein levels by Western blot (B) with actin as loading control. C, cells transfected with nonsilencing, LYVE1, or THBS2 siRNA were treated with or without 6 μm MS-275 for 24 h, harvested, and counted. Cell counts are expressed as total viable cells per well, mean ± S.D. of triplicate determinations. *, p < 0.05 for MS-275 treatment compared with untreated control. D, migration assays of cells transfected with nonsilencing, LYVE1, or THBS2 siRNA were carried out as described under “Experimental Procedures.” Representative images of one of three fields per insert by phase contrast microscopy (left panel) are shown. Migrated cells were stained, and the absorbance was measured at 560 nm (right). Values are means ± S.D. of quadruplicates from one experiment representative of three. Effect of MS-275 treatment: *, p < 0.05; comparison with control, †, p < 0.001; comparison with control plus MS-275, §, p < 0.001, determined by ANOVA.

