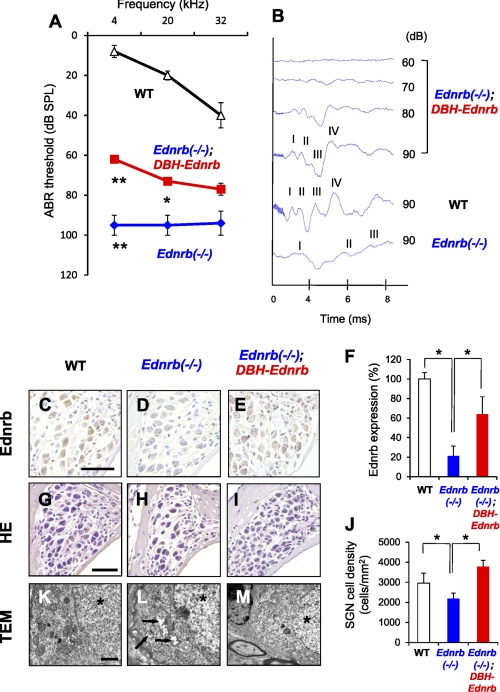
FIGURE 4.
Improvements of hearing levels in Ednrb−/− mice by DBH-Ednrb transgene. A, hearing levels (means ± S.E. (error bars)) in WT (n = 9), Ednrb−/− (n = 9), and Ednrb−/−;DBH-Ednrb mice (n = 12) on P19 measured by ABR. B, ABR waveforms of littermate WT, Ednrb−/−, and Ednrb−/−;DBH-Ednrb mice on P19 at 12-kHz sound. ABR wave peaks correspond to cochlear nerve activity (wave I) and downstream neural activities (waves II-–IV) (33, 34). C–E, immunohistochemical analysis of Ednrb expression in SGNs from WT (C), Ednrb−/− (D), and Ednrb−/−;DBH-Ednrb mice (E) on P19. F, percentage of positive SGN number (means ± S.E.) of Ednrb in Ednrb−/− mice (Ednrb−/−, blue bar, n = 3), Ednrb−/−;DBH-Ednrb mice (Ednrb−/−;DBH-Ednrb, red bar, n = 3) and littermate WT mice (WT, white bar, n = 3) to that in WT mice. G–I, H&E staining in SGNs at the basal turn from WT (G), Ednrb−/− (H), and Ednrb−/−;DBH-Ednrb mice (I) on P19. J, cell density (means ± S.E.) of SGNs from WT, Ednrb−/−, and Ednrb−/−;DBH-Ednrb mice on P19. K–M, TEM of SGNs from WT (K), Ednrb−/− (L), and Ednrb−/−;DBH-Ednrb mice (M) on P16. Vacuolar degeneration in SGNs from Ednrb−/− mice (arrows in L) was not observed in Ednrb−/−;DBH-Ednrb mice (M). Asterisks indicate nuclei (K–M). Scale bars: 50 μm (C–E, G–I), 1 μm (K–M). Significant difference (*, p < 0.05; **, p < 0.01) from the control was analyzed by the Mann-Whitney U test.

