FIGURE 5.
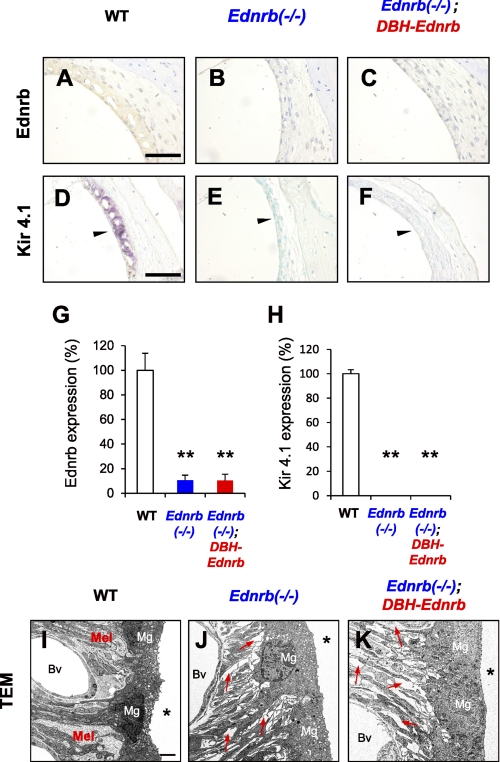
Melanocyte defect in the SV from Ednrb−/− mice was not rescued in Ednrb−/−;DBH-Ednrb mice. A–C, immunohistochemical analysis of Ednrb expression in the SV from WT mice (A), Ednrb−/− mice (B), and Ednrb−/−;DBH-Ednrb mice (C) on P19. D–F, immunohistochemical analysis of Kir4.1 expression, which is known as one of the melanocyte markers in the SV (27). Kir4.1-expressing cells were found in WT mice (purple signals indicated by arrowhead in D) but were not found in Ednrb−/− mice and Ednrb−/−;DBH-Ednrb mice (E and F). The methods used for staining are described in detail under “Experimental Procedures.” G and H, percentage (means ± S.E. (error bars)) of Ednrb (G) and Kir4.1 (H) expression levels in the SV from Ednrb−/− mice (Ednrb−/−, blue bar, n = 3), Ednrb−/−;DBH-Ednrb mice (Ednrb−/−;DBH-Ednrb, red bar, n = 3) and littermate WT mice (WT, white bar, n = 3) to that in the SV from WT mice. Significant difference (*, p < 0.05; **, p < 0.01) from the control was analyzed by the Mann-Whitney U test. I–K, TEM of the SV from Ednrb−/− mice (J), Ednrb−/−;DBH-Ednrb mice (K), and littermate WT mice (I) on P19. WT mice exhibited melanocytes (Mel in I) among marginal cells (Mg in I) and blood vessels (Bv in I), whereas Ednrb−/− mice and Ednrb−/−;DBH-Ednrb mice exhibited no melanocytes and many gaps (indicated by red arrows in J and K) among marginal cells (Mg in J and K) and blood vessels (Bv in J and K). Asterisk indicates endolymphatic space (I–K). Scale bars: 50 μm (A–F), 2 μm (I–K).

