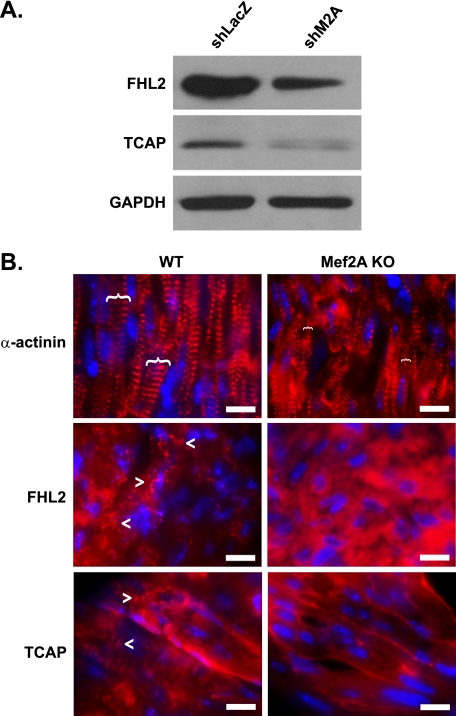
FIGURE 4.
Mef2A-deficient cardiomyocytes display costamere disruption. A, Western blot analysis of costamere gene expression in NRVMs. The expression of FHL2 and TCAP proteins is decreased in shM2A-transduced cultures. GAPDH is shown as a loading control. B, immunofluorescence of α-actinin, FHL2, and TCAP in perinatal day 2 WT and mutant (Mef2A KO) hearts. Top panels, relative width of Z-discs, as determined by α-actinin, are indicated by brackets. Middle and bottom panels, WT hearts display a punctate FHL2 and TCAP staining pattern (arrowheads) that is absent in Mef2A KO hearts. Note that FHL2 and TCAP only display the characteristic, striated pattern in adult skeletal muscle (see supplemental Fig. S3). Scale bars, 10 μm.

