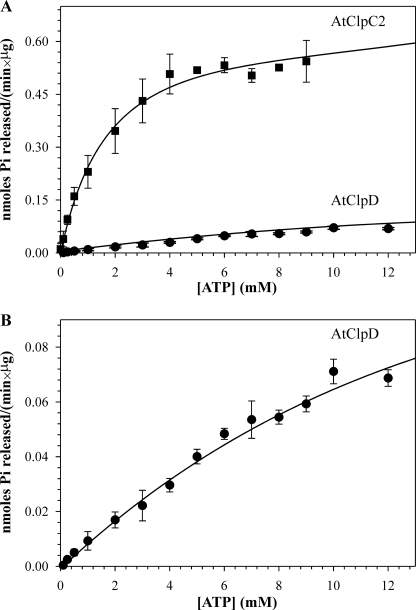
FIGURE 3.
Kinetic analysis of ATP hydrolysis by AtClpC2 and AtClpD. Release of inorganic phosphate was monitored spectrophotometrically by the Malachite green method. A, enzymatic activity of each protein is represented as a function of ATP concentration. B, same kinetic analysis of ATP hydrolysis by AtClpD shown in panel A is depicted with a different scale on the y-axis. Data points represent the mean of triplicate experiments, and bars show the standard error. The curve was fitted to the Michaelis-Menten equation (strong lines) using Sigma Plot.

