FIGURE 6.
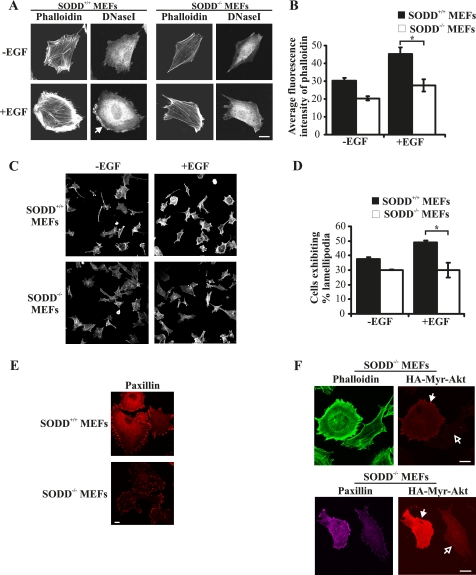
SODD−/− MEFs exhibit reduced actin polymerization. A, SODD+/+ or SODD−/− immortalized MEFs were serum-starved and stimulated with EGF (100 ng/ml) for 20 min. Cells were fixed, permeabilized, and co-stained with phalloidin-Alexa Fluor488 (F-actin) and DNase I-Alexa Fluor594 (G-actin) and visualized by confocal microscopy at the same laser attenuation. Closed arrow, cortical G-actin, indicative of lamellipodia formation. B, SODD+/+ or SODD−/− immortalized MEFs were treated as in A, and the total cellular F-actin levels were quantified by measuring the average fluorescence intensity of phalloidin-Alexa Fluor488 in 4–5 cells for each genotype. Bars, mean ± S.E. (error bars) of three independent experiments (*, p < 0.05). C, SODD+/+ and SODD−/− immortalized MEFs were serum-starved and stimulated with EGF (100 ng/ml) for 20 min. Cells were fixed, permeabilized, and stained with phalloidin-Alexa Fluor488 and visualized by confocal microscopy. D, MEFs were treated as in C, and the percentage of lamellipodia formation was quantified by calculating the average number of cells that demonstrated lamellipodia extension in ∼10 random fields from three independent experiments. Bars, mean ± S.E. of three independent experiments (*, p < 0.05). E, primary SODD+/+ or SODD−/− MEFs were grown in growth medium and then fixed, permeabilized, and stained with paxillin antibodies and visualized by confocal microscopy at the same laser attenuation. F, immortalized SODD−/− MEFs were reconstituted with constitutively active myristoylated Akt1 (HA-Myr-Akt1; closed arrows) by retroviral gene transfer; fixed, permeabilized, and co-stained with HA antibodies to identify transfected cells; and stained with phalloidin-Alexa Fluor488 (top) or paxillin antibodies (bottom) and imaged by confocal microscopy at the same laser attenuation. Open arrows, nontransfected cells. Bars, 20 μm.

