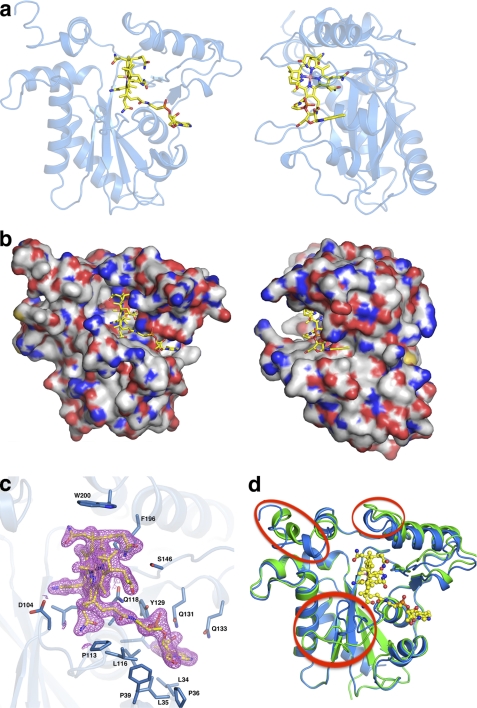
FIGURE 3.
Structure of holo-CblC. MeCbl·t-CblC shown in two orientations and displayed in schematic (a) and space-filling (b) representations. c, 2Fo − Fc electron density contoured at 1.5σ (magenta) and stick model (yellow) of MeCbl is shown with its immediate protein environment. Residues in close proximity to MeCbl are shown as sticks (blue). d, superposition of the apo- (green) and MeCbl- (blue) t-CblC structures in which the three major differences are encircled in red.

