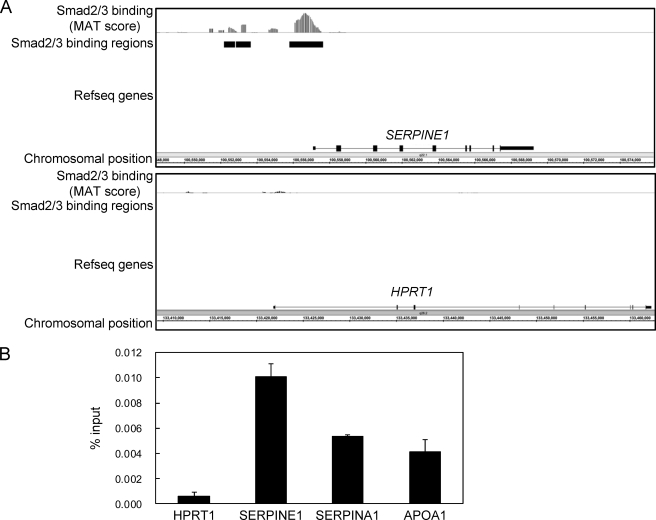
FIGURE 1.
Identification of Smad2/3 binding regions in HepG2 cells. A, Smad2/3 binding to the SERPINE1/PAI-1 locus in HepG2 cells. MAT scores were plotted at the SERPINE1 and HPRT1 loci to obtain a graphical representation of Smad2/3 binding in these regions. Significant Smad2/3 binding regions as determined by detection of p values of 10−4 are shown by black bars. B, percent input values of Smad2/3 binding compared with input genome as determined by ChIP-qPCR. Cells were treated with 120 pm TGF-β for 1.5 h. Cells were cross-linked sequentially with dimethyl adipimidate and formaldehyde. Error bars represent S.D.

