FIGURE 2.
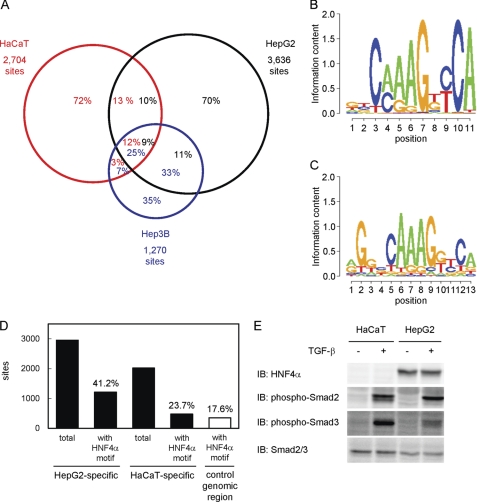
Comparison of the Smad2/3 binding regions among different cell lines. A, Venn diagrams showing the overlaps of Smad2/3 binding regions in HaCaT, HepG2, and Hep3B cells. Numbers in the circles indicate percentages of the Smad2/3 binding region of each cell line (red, HaCaT; black, HepG2; blue, Hep3B). B, identification of a motif conserved in HepG2-specific Smad binding regions. Partial genomic sequences within 250 bp from the peak positions of HepG2-specific Smad2/3 binding regions (n = 2,955) were analyzed using the CisGenome Gibbs motif sampler. Default parameters were used for the calculation, except for the numbers of motifs to be identified (n = 10). Matrix datum of the motif calculated by CisGenome was graphically shown using the SegLogo function of the R software. C, HNF4α-binding motif that matched the predicted motif in HepG2-specific Smad2/3 binding regions. The JASPAR CORE data base was used to identify known transcription factor binding motifs similar to the calculated matrix data in B. An HNF4α motif (ID: MA0114.1) was identified as the most similar motif with a comparison score of 21.3, which reached 96.9% of the potential maximal score. D, frequencies of the HNF4α-binding motif in Smad2/3 binding regions. Presence of the HNF4α-binding motif in each Smad2/3 binding region (within 250 bp from the peak signal position) was determined using CisGenome. Frequencies of the motif in either HepG2- or HaCaT-specific Smad2/3 binding regions were then calculated. As a control, matched genomic regions to HaCaT-specific Smad2/3 binding regions were obtained using CisGenome, and the frequency of the HNF4α motif was determined. E, expression of the HNF4α protein and phosphorylation of Smad2/3 in HaCaT and HepG2 cells. Cells were treated with TGF-β for 1.5 h, and the expression of each protein was determined by immunoblotting (IB).

