FIGURE 3.
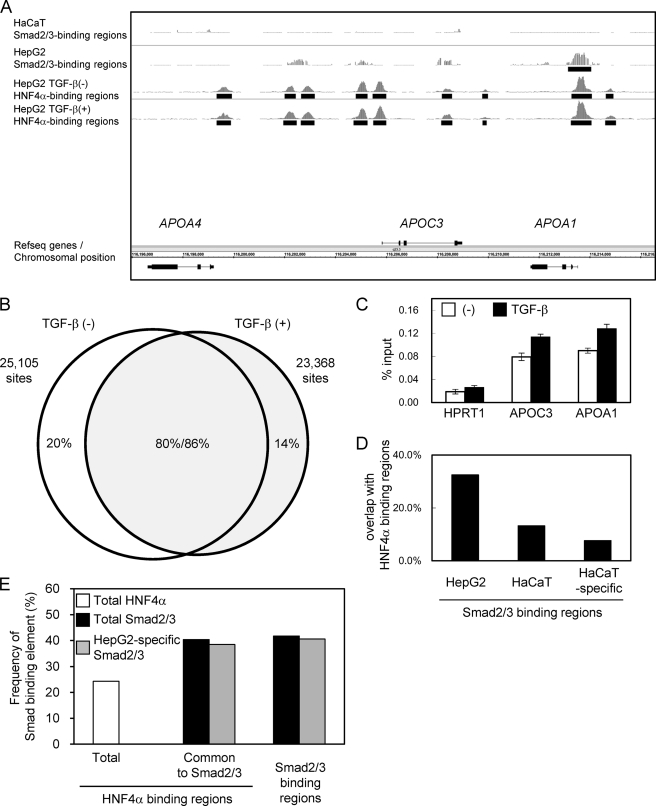
Identification of HNF4α binding regions in the presence and absence of TGF-β stimulation. A, graphical representation of HNF4α binding to the APOA4/APOC3/APOA1 gene loci. Sequence read numbers of 100-bp sliding window were plotted for HNF4α ChIP-seq samples. Smad2/3 bindings as determined by ChIP-chip analysis were shown in the upper two panels as in Fig. 1A. Black bars represent significant binding regions (FDR, <0.1%). B, Venn diagrams showing overlap between TGF-β-treated and untreated HNF4α binding regions. HNF4α binding regions were determined for each sample (FDR, <0.1%). HNF4α binding regions that have overlapping regions within 500 bp from their positions of maximum read numbers were considered as shared binding regions. C, changes in the HNF4α binding to APOC3 and APOA1 loci were quantitatively determined by ChIP-qPCR analysis. Error bars, S.D. D, frequencies of in vivo HNF4α binding to the Smad2/3 binding regions. Percentages of HNF4α binding within 250 bp from the peak signal position of Smad2/3 binding regions were calculated for the indicated Smad2/3 binding groups. E, frequencies of canonical Smad-binding elements in HNF4α binding regions compared with Smad binding regions in HepG2 cells. A Smad-binding element, M00974.SMAD that was identified as an enriched motif in HepG2-specific Smad2/3 binding regions using CEAS (see text), was selected for calculation. CisGenome was used for mapping of the motif. Presence of the motif for each HNF4α binding region and Smad2/3 binding region was determined using PerlScript.

