FIGURE 5.
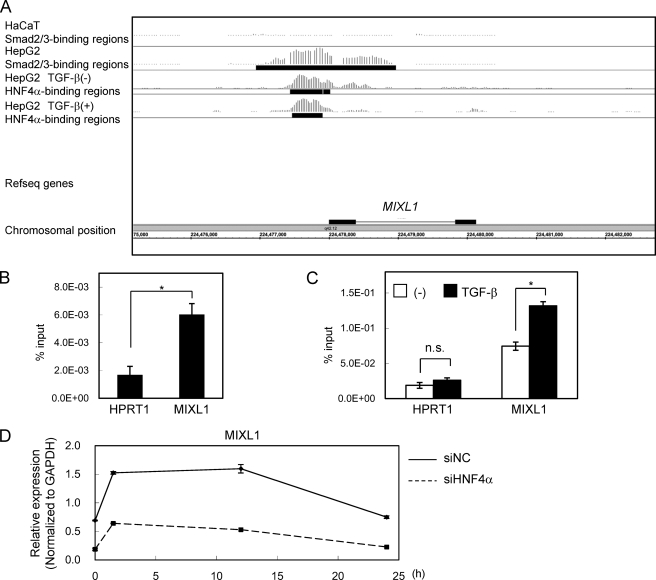
Smad2/3 and HNF4α bindings in the MIXL1 locus. A, Smad2/3- and HNF4α-enriched regions in the MIXL1 locus are shown as in Fig. 3A. B, HepG2 cells were treated with 120 pm TGF-β for 1.5 h, fixed in formaldehyde, and harvested. Smad2/3 binding to the MIXL1 locus was verified by ChIP-qPCR. HPRT1 served as a negative control. C, HepG2 cells were treated with or without 120 pm TGF-β for 1.5 h, and ChIP-qPCR analysis of the MIXL1 locus using anti-HNF4α was performed as in B. n.s., not significant. D, effects of knockdown of HNF4α on TGF-β-induced expression changes of MIXL1. HepG2 cells were transfected with control siRNA (siNC) or siHNF4α, treated with 3 ng/ml TGF-β for the indicated times, and harvested. HNF4α expression was quantified by RT-qPCR. *, p < 0.05; error bars, S.D.

