Abstract
Dysregulation of liver functions leads to insulin resistance causing type 2 diabetes mellitus and is often found in chronic liver diseases. However, the mechanisms of hepatic dysfunction leading to hepatic metabolic disorder are still poorly understood in chronic liver diseases. The current work investigated the role of hepatitis B virus X protein (HBx) in regulating glucose metabolism. We studied HBx-overexpressing (HBxTg) mice and HBxTg mice lacking inducible nitric oxide synthase (iNOS). Here we show that gene expressions of the key gluconeogenic enzymes were significantly increased in HepG2 cells expressing HBx (HepG2-HBx) and in non-tumor liver tissues of hepatitis B virus patients with high levels of HBx expression. In the liver of HBxTg mice, the expressions of gluconeogenic genes were also elevated, leading to hyperglycemia by increasing hepatic glucose production. However, this effect was insufficient to cause systemic insulin resistance. Importantly, the actions of HBx on hepatic glucose metabolism are thought to be mediated via iNOS signaling, as evidenced by the fact that deficiency of iNOS restored HBx-induced hyperglycemia by suppressing the gene expression of gluconeogenic enzymes. Treatment of HepG2-HBx cells with nitric oxide (NO) caused a significant increase in the expression of gluconeogenic genes, but JNK1 inhibition was completely normalized. Furthermore, hyperactivation of JNK1 in the liver of HBxTg mice was also suppressed in the absence of iNOS, indicating the critical role for JNK in the mutual regulation of HBx- and iNOS-mediated glucose metabolism. These findings establish a novel mechanism of HBx-driven hepatic metabolic disorder that is modulated by iNOS-mediated activation of JNK.
Keywords: Gluconeogenesis, Hepatitis Virus, Jun N-terminal Kinase (JNK), Metabolic Diseases, Nitric Oxide Synthase
Introduction
The liver is a key organ that regulates glucose homeostasis by balancing the storage of glucose and the output of glucose (1, 2). Pre-diabetes describes a condition affecting increasing numbers of the population who have abnormal glucose homeostasis but not diabetes mellitus and who suffer impaired glucose tolerance or fasting glucose (3). Glucose intolerance is common in patients with liver cirrhosis of various etiologies, and ∼20% of cirrhotic patients have overt diabetes (4). Recent observational studies have provided consistent evidence on associations of diabetes with increased risk of cancers of the liver (5). In Korea, both elevated fasting serum glucose levels and a diagnosis of diabetes are regarded as independent risk factors for several major cancers, including stomach, pancreatic, lung, and liver cancers, and the risks of these conditions increase with an increased level of fasting serum glucose (6). HBV4 infection is also strongly associated with type 2 diabetes among Asian, Asian Americans, Pacific Islanders, and Italians (7–10). Diabetic hyperglycemia is associated with serum alanine aminotransferase activity in patients with hepatitis B infection (11). However, the mechanisms by which HBV leads to glucose metabolism are not elucidated at all.
HBV is a hepatotrophic virus that causes acute and chronic hepatocellular injury. HBV X protein (HBx), one of four open reading frames in the HBV genome, has been implicated in regulating apoptosis, inflammation, and tumorigenesis (12, 13) by acting as a coactivator of transcription factors, including nuclear factor κB (NF-κB) (14), cAMP-response element-binding protein (CREB) (15), and mitogen-activated protein kinases (MAPKs) (16). Our previous studies demonstrated that HBx causes hepatic steatosis through the transcriptional activation of sterol regulatory element-binding protein 1 (SREBP1) and peroxisome proliferator-activated receptor (PPARγ) transcripts (17), suggesting the involvement of HBx in the transcriptional regulation of glucose metabolism-related genes.
Inflammation is an important pathogenic factor of metabolic liver diseases, including non-alcoholic steatohepatitis (18) and hepatogenous diabetes (19). Inflammatory mediators, such as nitric oxide and TNF-α, have been shown to impair the metabolic action of insulin in the liver, which ultimately results in hepatic dysfunction causing insulin resistance. Indeed, expression of inducible nitric oxide synthase (iNOS) was elevated in the liver of chronic HBV-infected patients (20). During acute or chronic HBV infection, HBx plays a pivotal role in the induction of hepatic inflammatory responses, as evidenced by the fact that HBx transactivates the promoter of the iNOS gene through the proximal NF-κB-binding site (21). Moreover, TNF-α synthesis induced by HBV is transcriptionally up-regulated by HBx in hepatocytes (22). These results imply that HBx may act as a key component connecting a link between hepatic glucose metabolism and inflammation.
In the current study, we investigated the role of HBx in glucose metabolism by studying transgenic mice that carry the HBx gene in vivo and cultured hepatic cell lines in vitro, with particular emphasis on transcriptional regulation of gluconeogenic enzymes and whole body glucose homeostasis. We also sought to determine whether activation of iNOS is required for HBx-mediated metabolic dysregulation. Here we show that increased HBx expression is sufficient to cause hyperglycemia and impaired glucose tolerance by enhancing gene expression of hepatic gluconeogenic enzymes and hepatic glucose production. These effects are thought to be regulated through nitric oxide (NO)/JNK signaling. Our data establish a novel function of HBx in the regulation of hepatic glucose homeostasis in chronic hepatitis-related metabolic diseases.
EXPERIMENTAL PROCEDURES
Detailed methods can be found in the supplemental material.
Animal Model
The generation of HBx homozygous transgenic (HBxTg) mice that have one copy of HBx transgene in chromosome 2 has been described previously (13); the strain of HBxTg mice was fixed to C57BL/6 by backcrossing with the C57BL/6 strain for more than 20 generations. The iNOS-deficient (C57BL/6-NOS2tm/Lau) mice were obtained from the Jackson Laboratory. Double mutant (HBxTg/iNOS−/−) mice were produced by crossing HBxTg mice with iNOS−/− mice. The mice were housed in a pathogen-free animal facility under a standard 12-h light/dark cycle. All animal procedures were conducted in accordance with the guidelines of the Institutional Animal Care and Use Committee, Korea Research Institute of Bioscience and Biotechnology (KRIBB, Daejeon, Korea).
Patients
The paired peritumoral and tumoral hepatocellular carcinoma (HCC) tissues of HBV patients were collected from the hospital of Chonbuk National University. The HBV patients only reacted to antibodies of HBV. All patients participating in this study gave informed consent before surgery.
Hyperinsulinemic-Euglycemic Clamp Study
Seven days prior to the hyperinsulinemic-euglycemic clamp studies, indwelling catheters were placed into the right internal jugular vein. After an overnight fast, [3-3H]glucose (HPLC-purified; PerkinElmer Life Sciences) was infused at a rate of 0.05 μCi/min for 2 h to assess the basal hepatic glucose production. Following the basal period, hyperinsulinemic-euglycemic clamp was conducted for 140 min with a primed/continuous infusion of human insulin (126 pmol/kg of prime, 18 pmol/kg/min of infusion) (Novo Nordisk). Blood samples (10 μl) were collected at 10–20-min intervals, plasma glucose was immediately analyzed during the clamps by a glucose oxidase method (GM9 Analyzer; Analox Instruments), and 20% dextrose was infused at variable rates to maintain plasma glucose at basal concentrations (∼6.7 mm). To estimate insulin-stimulated whole body glucose fluxes, [3-3H]glucose was infused at a rate of 0.1 μCi/min throughout the clamps, and 2-deoxy-d-[1-14C]glucose (PerkinElmer Life Sciences) was injected as a bolus at the 85th min of the clamp to estimate the rate of insulin-stimulated tissue glucose uptake, as described previously (23). Blood samples (10 μl) for the measurement of plasma 3H and 14C activities were taken at the end of the basal period and during the last 45 min of the clamp. Rates of basal and insulin-stimulated whole body glucose fluxes and tissue glucose uptake were determined as described previously (23).
Statistical Analysis
Data were analyzed using the SigmaStat 3.1 software. Quantitative data are presented as the mean ± the S.E. from at least three independent experiments. Comparisons between groups were analyzed by the unpaired two-tailed Student's t test or one-way or two-way analysis of variance with post hoc analyses, when appropriate, as indicated.
RESULTS
HBx Regulates the Expression of Gluconeogenic Genes
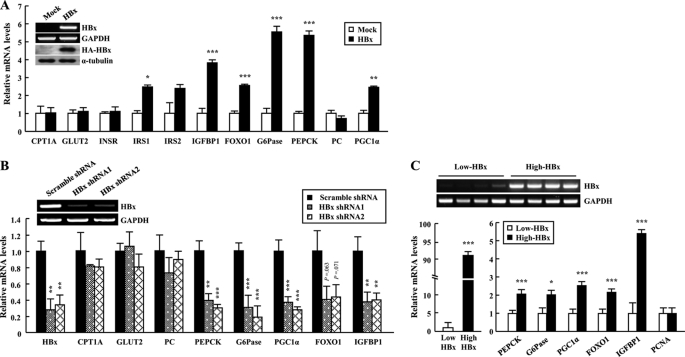
We investigated the effect of HBx on hepatic glucose metabolism by assessing gene expression of the key gluconeogenic enzymes in HepG2-HBx cells. Overexpression of HBx caused a significant increase in gene expression of gluconeogenic molecules (G6Pase, PEPCK, and PGC1α) and of FOXO1 and its target genes, such as insulin-like growth factor-binding protein-1 (IGFBP1) (24) and insulin receptor substrate 2 (IRS2) (25) in HepG2 cells (Fig. 1A). However, the glucose transporter 2 (GLUT2), insulin receptor (INSR), carnitine palmitoyltransferase 1a (CPT1a), and pyruvate carboxylase (PC) were unaltered by HBx overexpression (Fig. 1A). Conversely, shRNA-mediated suppression of HBx mRNA decreased gene expression of the key gluconeogenic enzymes in HepG2 cells (Fig. 1B). We also investigated gene expression of the key gluconeogenic enzymes in non-tumor liver tissues of HBV patients with high or low levels of HBx gene expression. The difference with HBx mRNA was ∼90-fold. Transcript levels of gluconeogenic genes in patients with high levels of HBx gene expression were significantly increased when compared with patients with low levels. However, there was no difference in expression of PCNA mRNA between groups, indicating that liver tissues are non-tumor (Fig. 1C). These data suggest that HBx plays a key role in regulating the expression of gluconeogenic genes in HepG2-HBx cells as well as in HBV patients.
FIGURE 1.
HBx regulates the gene expression of glucose metabolism-related molecules in hepatocytes. A, expression profiles of metabolic genes in HepG2 cells. B, expression profiles of metabolic genes of HepG2-HBx cells infected with lentiviruses expressing HBx shRNA. mRNA levels were analyzed by qRT-PCR. C, increased expression of gluconeogenic genes in HBV-infected patient livers. mRNA was purified from the non-tumor regions of patient livers with HBx expression and cancer (n = 15–22). Data are presented as the mean ± S.E. *, p < 0.05; **, p < 0.01; ***, p < 0.001 versus control.
HBx Expression Causes Impaired Glucose Tolerance in Mice
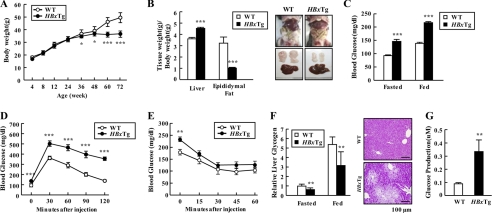
We next examined the physiological role of HBx in the regulation of glucose homeostasis and insulin sensitivity in vivo. HBxTg mice had normal body weight until 6 months of age; thereafter they did not gain weight when compared with wild-type (WT) mice (Fig. 2A). Liver weight in HBxTg mice was increased ∼25% when compared with WT mice, whereas adipose tissue mass decreased significantly (∼70%) (Fig. 2B). Furthermore, HBxTg mice showed several hepatic histopathological changes, including fatty changes, inflammation and dysplasia (supplemental Table 1), and an increase of serum parameters, such as triglyceride, cholesterol, and free fatty acid (Table 1). These observations indicate possible involvement of HBx in complicated liver metabolic diseases. Notably, HBxTg mice had a high risk for glucose intolerance, as evidenced by higher glucose levels in fasted and fed states (Fig. 2C). As expected, blood glucose levels at all times during the glucose tolerance tests were also markedly higher than controls (Fig. 2D). However, HBxTg mice showed insulin tolerance (Fig. 2E). After injection of insulin, blood glucose levels dropped to a similar rate in HBxTg mice and WT. Except at the starting point, blood glucose levels were virtually identical in the WT and HBxTg mice at various time points after insulin injection. However, unexpectedly serum insulin level was significantly lowered in HBxTg mice when compared with WT mice, regardless of feeding states, whereas serum glucagon level was greatly elevated in HBxTg mice (Table 1). Consistent with the results, hepatic glycogen level was significantly reduced in HBxTg livers in concert with an increase in hepatic glucose production (Fig. 2, F and G). These results suggest that the impaired glucose metabolism in HBxTg livers may be associated with the changes in hormones regulating serum glucose level.
FIGURE 2.
HBx expression causes impaired hepatic glucose metabolism in mice. A, growth curves were constructed by plotting mean ± S.E. body weight of WT and HBxTg mice (n = 11–16). B, comparison of liver and epididymal fat weight/body weight between WT (n = 7) and HBxTg (n = 8) mice at 6 months of age. C, glucose concentration in blood derived from mouse tail vein in 12-h fasted and ad libitum-fed mice at 6 months of age. D and E, insulin sensitivity was examined by a glucose tolerance test (D) and insulin tolerance test (E). Mice were 6 months of age (n = 10–13). F, glycogen content was measured in liver of 12-h fasted and ad libitum-fed mice (n = 6). Periodic acid-Schiff stained paraffin-embedded liver sections of HBxTg mice at 6 months of age. The scale bar represents 100 μm. G, glucose amount secreted in media from cultured primary hepatocytes of WT and HBxTg mice. Data are presented as the mean ± S.E. (*, p < 0.05; **, p < 0.01; ***, p < 0.001).
TABLE 1.
Serum parameters measured in 6-month-old mice fasted overnight
FFA, free fatty acid; ALT, alanine transaminase; AST, aspartate aminotransferase; LDL, low density lipoprotein; HDL, high density lipoprotein; ND, not determined. n = 8–11 mice per group. *, p < 0.05; **, p < 0.01; ***, p < 0.001 for WT versus HBxTg mice. #, p < 0.05; ##, p < 0.01; ###, p < 0.001 for HBxTg versus HBxTg/iNOS−/− mice. Data are expressed as means ± S.E.
| Parameter | WT | HBxTg | HBxTg/iNOS−/− |
|---|---|---|---|
| Triglyceride (mg/dl) | 78 ± 1.1 | 113 ± 2.6*** | 95 ± 5.6## |
| Cholesterol (mg/dl) | 120 ± 2.8 | 196 ± 3.7*** | 161 ± 5.2### |
| FFA (μmol/liter) | 1.156 ± 0.046 | 1.766 ± 0.043*** | 1.964 ± 0.107 |
| Serum insulin (ng/ml) | |||
| Fasted | 1.101 ± 0.182 | 0.340 ± 0.070 | 0.280 ± 0.015 |
| Fed | 1.842 ± 0.366 | 1.095 ± 0.235 | 1.010 ± 0.344 |
| Serum glucagon (pg/ml) | 414 ± 26 | 535 ± 27* | 458 ± 27 |
| ALT (unit/liter) | 41 ± 3.8 | 51 ± 2.8** | 43 ± 3.6 |
| AST (unit/liter) | 51 ± 5.1 | 83 ± 7.2* | 73 ± 5.6 |
| HDL (mg/dl) | 74 ± 4 | 89 ± 7** | ND |
| LDL (mg/dl) | 7 ± 2 | 12 ± 3* | ND |
| Adiponectin (μg/ml) | 23.3 ± 0.35 | 15.1 ± 0.23* | 18.9 ± 0.18# |
HBxTg Mice Increase Glucose Production
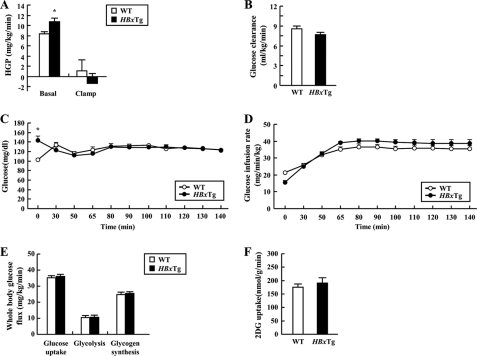
To further determine the role of HBx on fasting hyperglycemia and insulin resistance, we assessed basal hepatic glucose production and insulin-stimulated whole body and tissue-specific glucose fluxes in HBxTg using hyperinsulinemic-euglycemic clamp studies with radioisotope-labeled glucose infusion. The basal hepatic glucose production was significantly increased by 23% in HBxTg mice when compared with the WT mice (Fig. 3A). These data clearly indicate that fasting hyperglycemia observed in HBxTg mice was mostly attributed to increased hepatic glucose production because there was no difference in basal glucose clearance (Fig. 3B). However, whole body insulin sensitivity did not differ, as reflected by no difference in glucose infusion rate (Fig. 3, C and D). Moreover, there was no difference in insulin-induced suppression of hepatic glucose production and whole body (Fig. 3E) and muscle glucose uptake (Fig. 3F). These data suggest that HBx expression results in fasting hyperglycemia by increasing hepatic glucose production in vivo.
FIGURE 3.
Whole body glucose metabolism during hyperinsulinemic-euglycemic clamp in HBxTg mice. A and B, basal and clamp hepatic glucose production (HGP) (A) and basal glucose clearance (B) during the clamp of WT and HBxTg mice. C and D, plasma glucose concentrations (C) and glucose infusion rate (D) during the clamps. E and F, whole body glucose turnover rate, whole body glycolysis rate, whole body glycogen synthesis (E), and insulin-stimulated muscle (gastrocnemius) glucose uptake (F) were determined. 2DG, 2-deoxy-d-[1-14C]glucose. All data are presented as mean ± S.E. (*, p < 0.05, t test, n = 10–11).
Changes in Glucose Metabolism and Insulin Signaling in HBxTg Mice
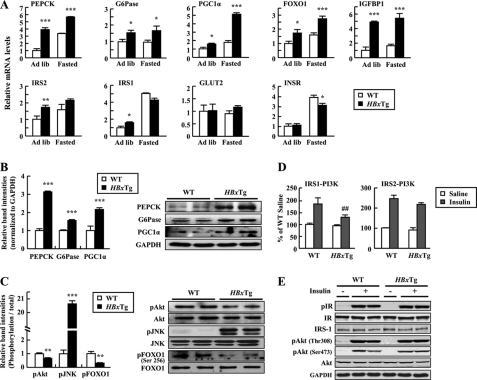
Gene expressions involved in glucose metabolism and insulin signaling were examined by qRT-PCR analysis (see supplemental Table 2) using the livers. Consistent with in vitro data, gene expressions of glucose metabolism-related molecules, including PEPCK, G6Pase, PGC1α, FOXO1, and IGFBP1, were significantly increased in the liver of HBxTg mice when compared with WT mice (Fig. 4A). These effects are independent of changes in nutritional states. HBxTg mice also had increased protein levels of PEPCK, G6Pase, and PGC1α in the liver (Fig. 4B).
FIGURE 4.
Hepatic expression of metabolic genes in HBxTg mice. A, mRNA levels were quantified by qRT-PCR in 6-month-old mice on ad libitum-fed (Ad lib) and 12-h fasted states. Each PCR was carried out in triplicate. B and C, immunoblot analysis of total liver lysates obtained from ad libitum-fed mice. pAkt, phosphorylated Akt; pJNK, phosphorylated JNK; pFOXO1, phosphorylated FOXO1. D, IRS-1 and IRS-2-associated PI 3-kinase activity in the liver from 12-h fasted state. Tissues were collected 6 min after intravenous saline or insulin (10 units/kg (body weight)) injection. E, insulin signaling in liver of WT and HBxTg mice. Liver lysates were subjected to SDS-PAGE and immunoblot with antibodies as indicated. pIR, phospho-insulin receptor; IR, insulin receptor. *, p < 0.05; **, p < 0.01; ***, p < 0.001 versus control. ##, p < 0.01 versus WT. The bars represent the S.E. (n = 4–7).
Basal Akt and FOXO1 phosphorylation was significantly reduced in the liver of HBxTg mice, whereas basal JNK phosphorylation was increased (Fig. 4C). The ability of insulin to increase PI3K (phosphatidylinositol 3-kinase) activity associated with IRS-1 but not IRS-2 was impaired in HBxTg mice when compared with WT mice (Fig. 4, D and E) without change in insulin receptor phosphorylation. Interestingly, insulin-stimulated Akt phosphorylation was normal, suggesting that maximal stimulation of Akt may not require the full activation of PI3K activity. Collectively, these data demonstrate that liver dysfunction induced by HBx may be associated with impaired PI3K activation.
Reciprocal Regulation in Expression between HBx and iNOS in Induction of Gluconeogenesis
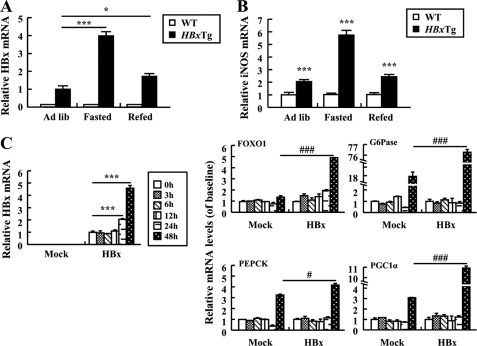
Studies revealed that HBx leads to hepatic inflammation by activating iNOS, which can produce NO (26). It is thus important to investigate whether increased levels of NO are sufficient to increase gene expression involved in gluconeogenic pathways in the presence of HBx. Our data demonstrated that iNOS mRNA was significantly increased in the liver of HBxTg mice when compared with WT mice, and its expression pattern was greatly similar to that of the HBx gene in nutritional states (Fig. 5, A and B). It is therefore likely that HBx and iNOS expression is mutually regulated under a certain condition and that hyperactivation of iNOS may contribute to the pathogenesis of HBx-induced hepatic gluconeogenesis. Furthermore, increased HBx mRNA levels were seen in HepG2-HBx cells treated with sodium nitroprusside (SNP), an NO donor, indicating NO-mediated expression of HBx. In control cells, gene expression of FOXO1 did not increase in response to SNP, whereas gene expression of G6Pase, PEPCK, and PGC1α was up-regulated. However, treatment of HepG2-HBx cells with SNP further increased the gene expression of G6Pase, PEPCK, PGC1α, and FOXO1 when compared with those of control HepG2 cells (Fig. 5C). Thus, our data suggest that gluconeogenesis genes were significantly up-regulated in HBxTg mice and HepG2-HBx cells, indicating that NO could induce gluconeogenesis through activation of HBx transcription.
FIGURE 5.
Reciprocal activation between HBx and iNOS in HepG2 cells and HBxTg mice. A and B, relative levels of HBx (A) and iNOS (B) mRNAs in HBxTg mice (n = 6–8) in ad libitum-fed (Ad lib), 12-h fasted, and refed states. C, expression of HBx and gluconeogenic genes mRNA in cells treated with SNP (50 μm) at the indicated times. All the data were the mean of three independent experiments and are indicated as mean ± S.E. (*, p < 0.05; ***, p < 0.001 versus control. #, p < 0.05; ###, p < 0.001 versus Mock).
Involvement of JNK1 in Induction of Gluconeogenic Genes by NO in HBx-overexpressing HepG2 Cells
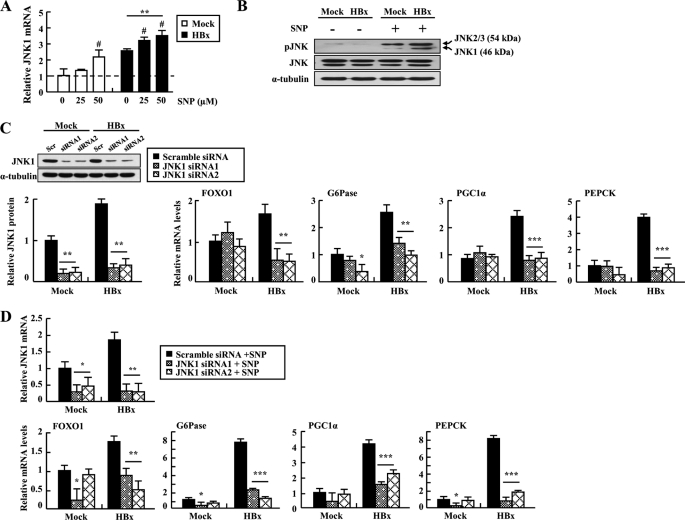
To investigate whether HBx/NO-mediated JNK activation leads to increased expression of gluconeogenic genes, we measured JNK1 expression and activity after NO treatment. Our experiment showed that JNK1 gene expression and phosphorylation were elevated by treatment of HepG2-HBx cells with SNP (Fig. 6, A and B). The results led us to hypothesize that activation of JNK is necessary for the transcriptional regulation of gluconeogenic molecules in hepatocytes overexpressing HBx. Consistent with this hypothesis, inhibition of JNK1 signaling significantly decreased HBx-induced mRNA levels of hepatic gluconeogenic genes (Fig. 6C). In addition, these effects were unaltered by treating HepG2-HBx cells transfected with JNK1 siRNA with SNP, confirming that JNK1 is a downstream mediator of NO signaling (Fig. 6D). Taken together, these data suggest that HBx/NO-mediated JNK activation may contribute to the up-regulation of hepatic gluconeogenic genes.
FIGURE 6.
Involvement of JNK1 in induction of gluconeogenic genes by NO in HBx-expressed cells. A, relative JNK1 transcript levels of cells treated with the indicated concentrations of SNP for 48 h (#, p < 0.05 versus 0 μm). B, immunoblot analysis of phosphorylated JNK (pJNK) in cells treated with SNP (50 μm). C, expression profiles of metabolic genes in cells treated with JNK1 siRNA. Levels of JNK1 mRNA 48 h after transfection with siRNAs were evaluated by qRT-PCR and immunoblotting assays. Scr, scrambled. D, HepG2 cells were transfected with JNK1 siRNA at 24 h before treatment with SNP (50 μm) for 48 h, and the transcript levels of JNK1 and gluconeogenic genes were analyzed by qRT-PCR. *, p < 0.05; **, p < 0.01; ***, p < 0.001. Each PCR was carried out in triplicate.
Deficiency of iNOS Normalizes HBx-induced Impaired Glucose Tolerance in Mice
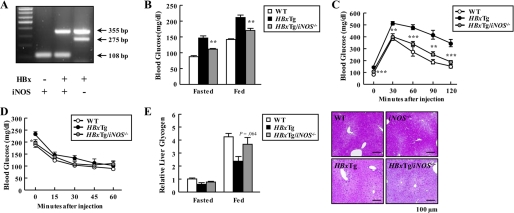
We further determined whether blockade of iNOS signaling could prevent the ability of HBx to induce hyperglycemia and impaired glucose tolerance in mice. Toward this end, we generated HBxTg mice that lacked iNOS gene expression by breeding HBxTg mice with iNOS−/− mice (Fig. 7A). Elevated glucose levels in HBxTg mice were normalized to the level of WT mice by a deficiency of iNOS in HBxTg/iNOS−/− mice (Fig. 7B). Aligned with these findings, iNOS deficiency completely rescued hyperglycemia and impaired glucose tolerances that were seen in HBxTg mice (Fig. 7, C and D). However, plasma insulin levels in HBxTg mice were unaltered by loss of iNOS, suggesting the specificity of iNOS action, and serum glucagon levels were lowered in HBxTg/iNOS−/− mice in the fasted state when compared with HBxTg mice (Table 1). Moreover, hepatic glycogen levels and serum levels of triglyceride and cholesterol in HBxTg/iNOS−/− mice were restored to those of WT mice (Fig. 7E and Table 1). These data strongly suggest that iNOS signaling is required for HBx-induced hepatic impaired glucose tolerance in mice.
FIGURE 7.
Effect of iNOS on glycemic control in HBxTg mice. A, PCR analysis of genomic DNA from mouse tails (HBxTg, 355 bp; iNOS wild allele, 108 bp; iNOS mutant allele, 275 bp). B, blood glucose levels in 12-h fasted and ad libitum-fed mice. C and D, insulin sensitivity was examined by a glucose tolerance test (C) and an insulin tolerance test (D). Mice were 6 months of age (n = 6–10). E, liver glycogen contents measured in the liver lysates of 12-h fasted and ad libitum-fed mice (n = 6). Periodic acid-Schiff stained paraffin-embedded liver sections at 6 months of age. *, p < 0.05; **, p < 0.01; ***, p < 0.001 for HBxTg versus HBxTg/iNOS−/− mice.
Reduced Expression of Metabolic Genes in HBxTg/iNOS−/− Mice
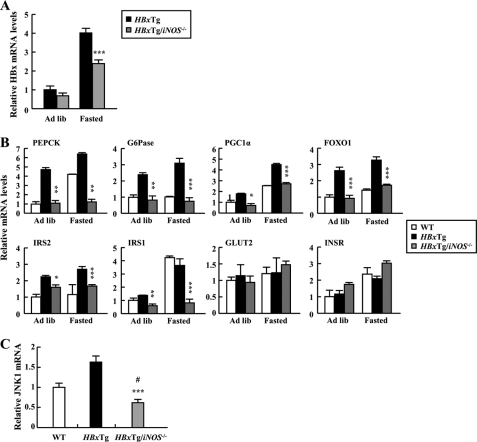
The fact that deficiency of iNOS normalizes impaired glucose tolerance in HBxTg mice promptly led us to investigate gene expression of glucose metabolism-related molecules in the liver of HBxTg/iNOS−/− mice. Hepatic HBx mRNA levels were significantly decreased in the fasted state in HBxTg/iNOS−/− mice when compared with HBxTg mice (Fig. 8A), indicating NO-dependent HBx up-regulation. Deficiency of iNOS led to a significant decrease in gene expression levels of glucose metabolism-related molecules, including PEPCK, G6Pase, PGC1α, FOXO1, IRS1, and IRS2, all of which were elevated in the liver of HBxTg mice (Fig. 8B). In addition, hepatic JNK1 mRNA levels were significantly decreased when iNOS was deleted in HBxTg mice (Fig. 8C). Collectively, these results suggest that iNOS plays an essential role in regulating HBx-induced expression of hepatic gluconeogenic key enzymes, which could contribute to the pathogenesis of hepatic metabolic dysfunction.
FIGURE 8.
Normalization of the expression of genes related to glucose metabolism by deficiency of iNOS in HBxTg mice. A, HBx mRNA levels were quantified by qRT-PCR in ad libitum-fed (Ad lib) and 12-h fasted states in HBxTg (n = 6) and HBxTg/iNOS−/− (n = 8) mice. B, metabolic gene expression of 6-month-old mice in ad libitum-fed and 12-h fasted states. C, relative levels of hepatic JNK1 gene expression in mice (n = 5–6). *, p < 0.05; ** p < 0.01; ***, p < 0.001 for HBxTg versus HBxTg/iNOS−/− mice. #, p < 0.05 versus WT.
DISCUSSION
The current study investigated the role of HBx in the regulation of hepatic glucose metabolism, specifically the impact of gluconeogenesis. Hepatic glucose production was greatly increased in HBxTg liver, which is most likely due to the increased expression of gluconeogenic genes (PEPCK, PGC1α, and G6Pase). Ultimately, the enhanced gluconeogenesis further caused hyperglycemia in HBxTg mice with age. Interestingly, nitric oxide-induced JNK activation is closely associated with the disturbed hepatic glucose metabolism. Thus, our data provide compelling evidences that HBx is an important player in regulating hepatic glucose homeostasis during the progression of chronic hepatitis-related metabolic diseases.
Inflammation has been implicated as an important etiological factor in the development of both hyperglycemia and type 2 diabetes. HBx induces the intrahepatic inflammatory process during acute and chronic hepatitis progression and HCC developments (22). Recently, we notified that HBx transactivates the iNOS gene promoter through the proximal NF-κB-binding site (21). Here we showed that the level of iNOS transcript was significantly increased in the liver of HBxTg mice. Interestingly, HBx expression was also increased by treatment of HepG2-HBx cells with a NO donor. Moreover, the NO donor triggers induction of gluconeogenic genes in these cells. Based on these results, we suggest that the impairment in regulation of gluconeogenesis may be accelerated by the synergistic action between HBx and iNOS.
Gluconeogenesis is strongly stimulated during fasting and is aberrantly activated in type 2 diabetes. The transcriptional coactivator PGC1α was strongly induced in the liver in fasting mice and in mouse models of insulin action deficiency (27). Likewise, PGC1α mRNA in HBxTg mice was significantly increased in the fasting state when compared with the ad libitum-fed state. It is interesting that PGC1α mRNA was more highly increased in HBxTg mice than in control animals even in the state of ad libitum, suggesting that HBx modulates PGC1α transcription in mice.
Akt signaling has been implicated in the regulation of hepatic glucose metabolism (28). HBx-induced inflammatory stress is associated with impairment in Akt phosphorylation, which was partially mediated by the JNK pathway in hepatocytes (29). JNK is known to induce serine phosphorylation of IRS-1 and thereby reduce the activity of IRS-1 and also its downstream target, Akt. Similarly, the current study has shown that in HBxTg liver, decreased Akt phosphorylation and increased JNK1 phosphorylation were observed, whereas JNK1 phosphorylation was alleviated by null mutation of iNOS. In addition, it is known that FOXO1 is mainly determined by Akt phosphorylation status (30). In general, the function of FOXO1 is closely associated with hepatic glucose homeostasis as a transcription factor governing the expression of gluconeogenic genes. Thus, impairment in regulation of FOXO1 signaling may ultimately cause imbalance of hepatic glucose metabolism. Consistent with this, FOXO1 phosphorylation was greatly reduced in HBxTg liver when compared with WT mice (Fig. 4C). Based on these observations, we suggest that HBx-driven impairment in hepatic glucose metabolism may be dependent on the cross-talk between the IRS-1/Akt/FOXO1 and JNK1 signaling pathways.
It is known that NO-mediated increase in TNF-α or free fatty acid caused suppression of insulin secretion and insulin resistance (31) and that low levels of adiponectin were associated with impaired glucose tolerance and the development of type 2 diabetes (32). Our studies found that serum adiponectin concentrations were significantly decreased in HBxTg mice when compared with WT mice (Table 1), whereas TNF-α and free fatty acid were significantly increased (data not shown). Interestingly, deficiency of iNOS normalized the levels of serum adiponectin but not TNF-α and free fatty acid levels in HBxTg mice, suggesting that adiponectin may be involved in the development of HBx-induced glucose intolerance (Table 1). However, it is unclear at this time whether an elevated serum insulin level is due to the direct action of HBx on insulin secretion or secondary effects. It must be further studied in the future.
Experimental evidence revealed that NO donor impaired the ability of insulin to stimulate glucose uptake in muscle cell (33) and glycogen synthesis in hepatocytes (34), indicating the inhibitory role for iNOS on insulin action. Support for this comes from the findings that NO donor administration caused hyperglycemia in mice (35). Here we demonstrated that deficiency of iNOS in HBxTg mice selectively normalized serum glucose levels but not insulin levels. These effects are most likely due to the inhibition of gluconeogenesis, as indicated by the fact that increased gene expression of gluconeogenic enzymes was restored to normal levels by deletion of iNOS. Thus, iNOS plays a critical role in regulating glucose homeostasis and functions as a key determinant of HBx-induced hyperglycemia.
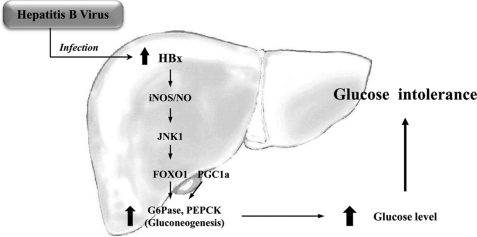
Based on our studies, we propose a hypothesis for the involvement of HBx in regulating hepatic glucose metabolism. Increased HBx expression by HBV causes hyperglycemia through the activation of the gluconeogenic signaling pathway. This is thought to be mediated via iNOS signaling (Fig. 9). Thus, HBx functions as an important regulator of hepatic glucose metabolism that is closely associated with inflammation in hepatitis-induced liver diseases. Finally, these findings will be useful for discovery of potential treatment targets for dysregulated metabolism in HBV patients and future anti-HBV therapy.
FIGURE 9.
A potential mechanism by which HBx leads to impaired hepatic glucose metabolism. Induction of HBx and iNOS is mutually activated, and HBx participates in activation of the JNK1/FOXO1 signaling pathway. Coupled with PGC1α activation, FOXO1 participates in up-regulation of gluconeogenic genes, such as G6Pase and PEPCK. Thus, blood glucose level is increased, and the risk of glucose intolerance is enhanced by the impaired hepatic glucose metabolism.
Supplementary Material
This work was supported by the 21st Century Frontier Program in the Functional Human Genome Project (Grant HGM0200934), by the International Collaboration Program of Science and Technology (Grant FGM0600914), by the World Class Institute (WCI) Program of the National Research Foundation of Korea (NRF) funded by the Ministry of Education, Science and Technology of Korea (MEST), by a grant from the National R&D Program for Cancer Control, Ministry for Health and Welfare (Grant BCM0061011), by the KRIBB Research Initiative Program Grant (Grant KGM3320911), by a grant of the Korea Healthcare technology R&D Project, Ministry for Health, Welfare and Family Affairs, Korea (Grant A084651) (to C. S. C.), and by National Institutes of Health Grant R01DK083567 (to Y. B. K.) and American Diabetes Association Grant 1-09-RA-87) (to Y. B. K.).

The on-line version of this article (available at http://www.jbc.org) contains supplemental methods and Tables 1 and 2.
- HBV
- hepatitis B virus
- HBx
- hepatitis B virus X protein
- iNOS
- inducible nitric oxide synthase
- Tg
- transgenic
- PEPCK
- phosphoenolpyruvate carboxykinase
- G6Pase
- glucose-6-phosphatase
- PGC1α
- peroxisome proliferator-activated receptor-γ coactivator 1α
- qRT-PCR
- quantitative real-time reverse-transcription polymerase chain reaction.
REFERENCES
- 1. Nordlie R. C., Foster J. D., Lange A. J. (1999) Annu. Rev. Nutr. 19, 379–406 [DOI] [PubMed] [Google Scholar]
- 2. Pilkis S. J., Granner D. K. (1992) Annu. Rev. Physiol. 54, 885–909 [DOI] [PubMed] [Google Scholar]
- 3. Expert Committee on the Diagnosis and Classification of Diabetes Mellitus (2003) Diabetes Care 26, Suppl. 1, S5–S20 [DOI] [PubMed] [Google Scholar]
- 4. Kruszynska Y. T., Home P. D., McIntyre N. (1991) Hepatology 14, 103–111 [DOI] [PubMed] [Google Scholar]
- 5. La Vecchia C., Negri E., Decarli A., Franceschi S. (1997) Int. J. Cancer 73, 204–207 [DOI] [PubMed] [Google Scholar]
- 6. Jee S. H., Ohrr H., Sull J. W., Yun J. E., Ji M., Samet J. M. (2005) JAMA 293, 194–202 [DOI] [PubMed] [Google Scholar]
- 7. Cheng A. Y., Kong A. P., Wong V. W., So W. Y., Chan H. L., Ho C. S., Lam C. W., Tam J. S., Chow C. C., Cockram C. S., Chan J. C., Tong P. C. (2006) Diabetologia 49, 1777–1784 [DOI] [PubMed] [Google Scholar]
- 8. Custro N., Carroccio A., Ganci A., Scafidi V., Campagna P., Di Prima L., Montalto G. (2001) Diabetes Metab. 27, 476–481 [PubMed] [Google Scholar]
- 9. Nguyen M. H., Keeffe E. B. (2003) Rev. Gastroenterol. Disord. 3, 125–134 [PubMed] [Google Scholar]
- 10. Centers for Disease Control and Prevention (CDC) (2006) MMWR Morb. Mortal. Wkly. Rep. 55, 505–509 [PubMed] [Google Scholar]
- 11. Wang Y. Y., Lin S. Y., Sheu W. H., Liu P. H., Tung K. C. (2010) Metabolism 59, 486–491 [DOI] [PubMed] [Google Scholar]
- 12. Kim C. M., Koike K., Saito I., Miyamura T., Jay G. (1991) Nature 351, 317–320 [DOI] [PubMed] [Google Scholar]
- 13. Yu D. Y., Moon H. B., Son J. K., Jeong S., Yu S. L., Yoon H., Han Y. M., Lee C. S., Park J. S., Lee C. H., Hyun B. H., Murakami S., Lee K. K. (1999) J. Hepatol. 31, 123–132 [DOI] [PubMed] [Google Scholar]
- 14. Su F., Theodosis C. N., Schneider R. J. (2001) J. Virol. 75, 215–225 [DOI] [PMC free article] [PubMed] [Google Scholar]
- 15. Cougot D., Wu Y., Cairo S., Caramel J., Renard C. A., Lévy L., Buendia M. A., Neuveut C. (2007) J. Biol. Chem. 282, 4277–4287 [DOI] [PubMed] [Google Scholar]
- 16. Nijhara R., Jana S. S., Goswami S. K., Rana A., Majumdar S. S., Kumar V., Sarkar D. P. (2001) J. Virol. 75, 10348–10358 [DOI] [PMC free article] [PubMed] [Google Scholar]
- 17. Kim K. H., Shin H. J., Kim K., Choi H. M., Rhee S. H., Moon H. B., Kim H. H., Yang U. S., Yu D. Y., Cheong J. (2007) Gastroenterology 132, 1955–1967 [DOI] [PubMed] [Google Scholar]
- 18. Watanabe S., Yaginuma R., Ikejima K., Miyazaki A. (2008) J. Gastroenterol. 43, 509–518 [DOI] [PubMed] [Google Scholar]
- 19. García-Compean D., Jaquez-Quintana J. O., Maldonado-Garza H. (2009) Ann. Hepatol. 8, 13–20 [PubMed] [Google Scholar]
- 20. Majano P. L., García-Monzón C., López-Cabrera M., Lara-Pezzi E., Fernández-Ruiz E., García-Iglesias C., Borque M. J., Moreno-Otero R. (1998) J. Clin. Invest. 101, 1343–1352 [DOI] [PMC free article] [PubMed] [Google Scholar]
- 21. Majano P., Lara-Pezzi E., López-Cabrera M., Apolinario A., Moreno-Otero R., García-Monzón C. (2001) Hepatology 34, 1218–1224 [DOI] [PubMed] [Google Scholar]
- 22. Lara-Pezzi E., Majano P. L., Gómez-Gonzalo M., García-Monzón C., Moreno-Otero R., Levrero M., López-Cabrera M. (1998) Hepatology 28, 1013–1021 [DOI] [PubMed] [Google Scholar]
- 23. Choi C. S., Savage D. B., Abu-Elheiga L., Liu Z. X., Kim S., Kulkarni A., Distefano A., Hwang Y. J., Reznick R. M., Codella R., Zhang D., Cline G. W., Wakil S. J., Shulman G. I. (2007) Proc. Natl. Acad. Sci. U.S.A. 104, 16480–16485 [DOI] [PMC free article] [PubMed] [Google Scholar]
- 24. Guo S., Rena G., Cichy S., He X., Cohen P., Unterman T. (1999) J. Biol. Chem. 274, 17184–17192 [DOI] [PubMed] [Google Scholar]
- 25. Zhang J., Ou J., Bashmakov Y., Horton J. D., Brown M. S., Goldstein J. L. (2001) Proc. Natl. Acad. Sci. U.S.A. 98, 3756–3761 [DOI] [PMC free article] [PubMed] [Google Scholar]
- 26. Xie Q. W., Cho H. J., Calaycay J., Mumford R. A., Swiderek K. M., Lee T. D., Ding A., Troso T., Nathan C. (1992) Science 256, 225–228 [DOI] [PubMed] [Google Scholar]
- 27. Yoon J. C., Puigserver P., Chen G., Donovan J., Wu Z., Rhee J., Adelmant G., Stafford J., Kahn C. R., Granner D. K., Newgard C. B., Spiegelman B. M. (2001) Nature 413, 131–138 [DOI] [PubMed] [Google Scholar]
- 28. Li X., Monks B., Ge Q., Birnbaum M. J. (2007) Nature 447, 1012–1016 [DOI] [PubMed] [Google Scholar]
- 29. Nakatani Y., Kaneto H., Kawamori D., Hatazaki M., Miyatsuka T., Matsuoka T. A., Kajimoto Y., Matsuhisa M., Yamasaki Y., Hori M. (2004) J. Biol. Chem. 279, 45803–45809 [DOI] [PubMed] [Google Scholar]
- 30. Huang H., Tindall D. J. (2007) J. Cell Sci. 120, 2479–2487 [DOI] [PubMed] [Google Scholar]
- 31. Corbett J. A., Sweetland M. A., Wang J. L., Lancaster J. R., Jr., McDaniel M. L. (1993) Proc. Natl. Acad. Sci. U.S.A. 90, 1731–1735 [DOI] [PMC free article] [PubMed] [Google Scholar]
- 32. Nakashima Y., Inukai K., Imai K., Ikegami Y., Awata T., Katayama S. (2008) Metabolism 57, 1350–1354 [DOI] [PubMed] [Google Scholar]
- 33. Kapur S., Bédard S., Marcotte B., Côté C. H., Marette A. (1997) Diabetes 46, 1691–1700 [DOI] [PubMed] [Google Scholar]
- 34. Sprangers F., Sauerwein H. P., Romijn J. A., van Woerkom G. M., Meijer A. J. (1998) Biochem. J. 330, 1045–1049 [DOI] [PMC free article] [PubMed] [Google Scholar]
- 35. McGowder D., Ragoobirsingh D., Dasgupta T. (1999) Nitric Oxide 3, 481–491 [DOI] [PubMed] [Google Scholar]
Associated Data
This section collects any data citations, data availability statements, or supplementary materials included in this article.


