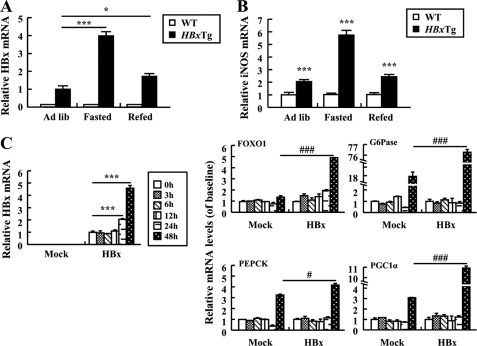
FIGURE 5.
Reciprocal activation between HBx and iNOS in HepG2 cells and HBxTg mice. A and B, relative levels of HBx (A) and iNOS (B) mRNAs in HBxTg mice (n = 6–8) in ad libitum-fed (Ad lib), 12-h fasted, and refed states. C, expression of HBx and gluconeogenic genes mRNA in cells treated with SNP (50 μm) at the indicated times. All the data were the mean of three independent experiments and are indicated as mean ± S.E. (*, p < 0.05; ***, p < 0.001 versus control. #, p < 0.05; ###, p < 0.001 versus Mock).

