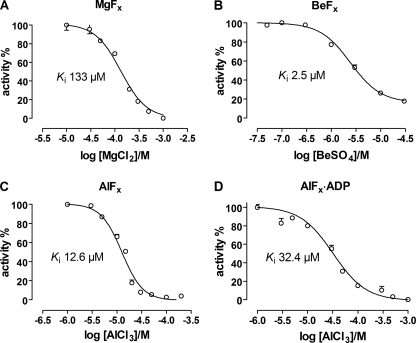
FIGURE 2.
Inhibition of Na,K-ATPase activity by various fluoride complexes at pH 7.5. The NaF concentration is 5 mm in all experiments. The data were fitted by a Hill equation shown as the solid curve. The Hill coefficients were significantly different from −1 in all cases. A, inhibition by MgFx. The fit parameters were: Ki = 133 ± 3 μm, nH = −1.63 ± 0.07. B, inhibition by BeFx. The inhibitor constant Ki = 2.42 ± 0.02 μm, nH = −1.44 ± 0.08. C, inhibition by AlFx. The inhibitor constant Ki = 10.9 ± 0.2 μm, nH = −3.2 ± 0.2. D, inhibition by AlFx in the presence of 1 mm ADP. The inhibitor constant Ki = 20.9 ± 0.3 μm, nH = −1.59 ± 0.07.

