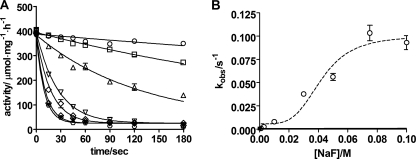
FIGURE 4.
Time course of NaF inhibition of Na,K-ATPase activity at increasing NaF-concentration and a constant MgCl2 concentration of 5 mm at pH 7.5. A, rate of inhibition at increasing NaF concentrations (1, 3, 10, 30, 50, 75, and 100 mm). The curves are one-phase exponential fits. B, observed rate constants, kobs as a function of the NaF concentration. The stippled curve shows the fitted Hill equation with a K0.5 values of 42 ± 4 mm and a Hill coefficient set to 4.0.

