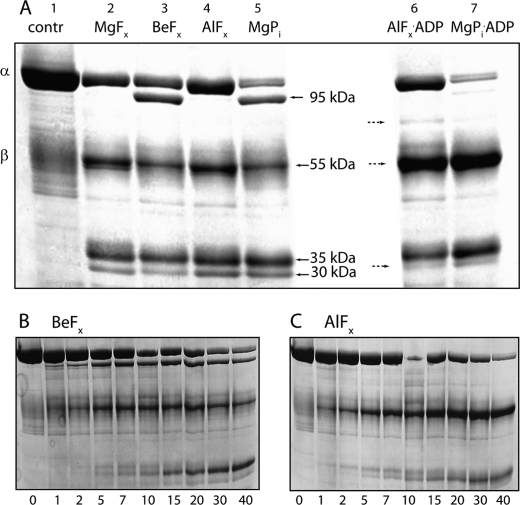
FIGURE 6.
PK treatment of Na,K-ATPase phosphorylated by MgPi or by different metal fluorides. A, in lane 1 untreated enzyme is shown with positions of the α- and β-subunits (∼100 and 55 kDa) indicated. In lanes 2–7, 100 μg of protein was suspended in 25 mm histidine, pH 7.0 and treated with the following ligands to stabilize the enzyme in specific phosphoenzyme states: 4 mm NaF and 4 mm MgCl2 (E·MgFx, lane 2), 4 mm NaF and 50 μl of BeSO4 (E·BeFx, lane 3), 4 mm NaF, and 100 μm AlCl3 (E·AlFx, lane 4), 4 mm MgCl2, and 1 mm Pi (MgPi, lane 5). The right hand part of the gel show the effects of ADP: 4 mm NaF and 100 μm AlCl3 plus 1 mm ADP (E·AlFx·ADP, lane 6) and 4 mm MgCl2 and 1 mm Pi + 1 mm ADP (MgPi·ADP, lane 6). Bands that are sensitive to addition of ADP are indicated by stippled arrows. B, time course (0–40 min) of PK cleavage of BeFx-treated enzyme. C, time course (0–40 min) of PK cleavage of AlFx-treated enzyme. After termination of proteolysis 40 μg of protein was loaded onto 8% SDS-PAGE, and the gel was stained with Coomassie Blue. The molecular masses of most prominent bands are indicated by arrows. A representative of three independent experiments is shown.

