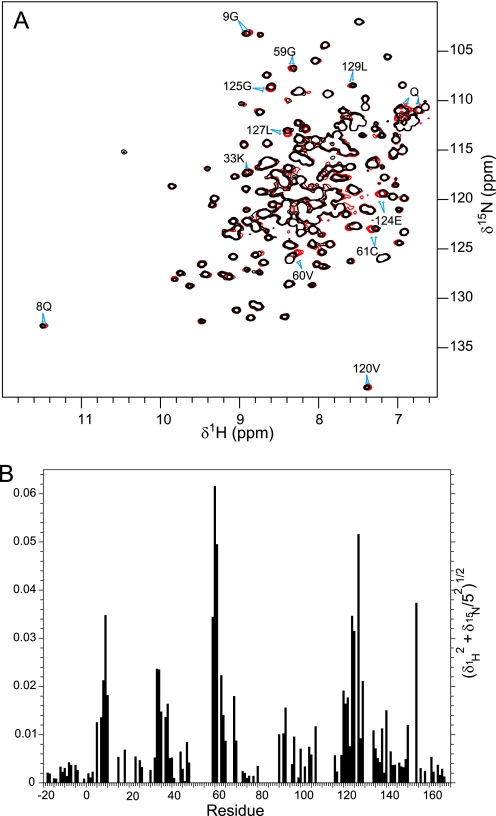
FIGURE 3.
NMR chemical shift perturbation of ypTpx by ME0052. A, 15N HSQC spectra of 100 μm ypTpx in the absence (black) and presence (red) of 200 μm ME0052. A selection of the most perturbed cross peaks is indicated with their assignments, and a perturbed glutamine side chain is indicated (Q). B, a histogram of the weighted amide chemical shift perturbation by residue reveals clusters of residues affected by ligand binding.

