FIGURE 4.
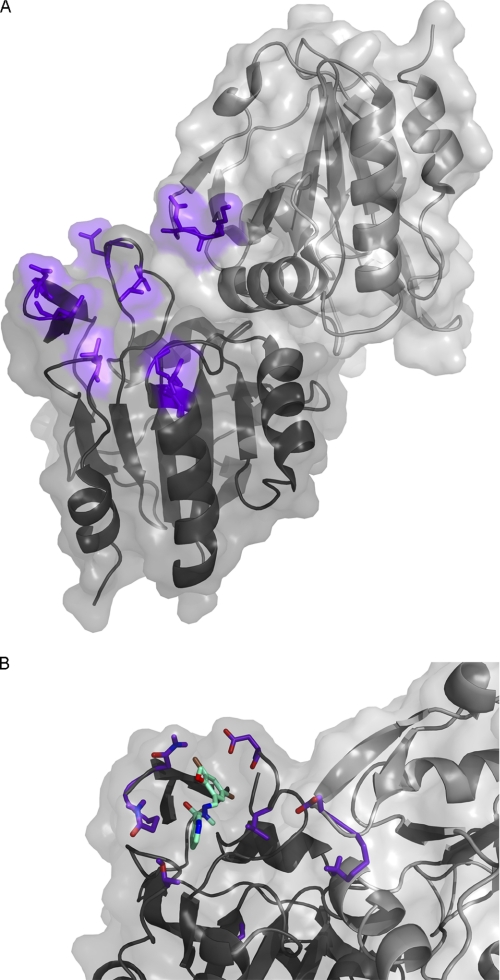
Mapping of residues involved in drug binding and ligand docking. A, shown is a schematic representation of the structure of ecTpx (PDB code 3HVV (43)) colored purple by the shifts observed when ME0052 is added to ypTpx. Subunit A is in dark gray, and subunit B is in lighter gray. B, shown is a surface representation of the ecTpx dimer, with the docked compound ME0052 (cyan) based on the residues with the highest shift (purple sticks) using Autodock Vina. The figures were created in PyMOL (56).

