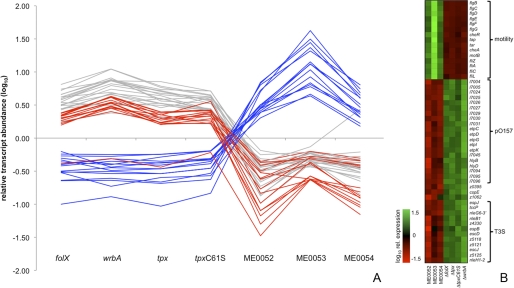
FIGURE 6.
Comparison of gene expression between bacteria cultured with salicylidene acylhydrazides and defined mutants. Microarray data were filtered for transcripts that showed significant changes in gene expression (>1.5-fold, p < 0.05) when treated with salicylidene acylhydrazides (ME0052, ME0053, ME0054) and that also showed >5-fold changes in transcript abundance when compared with the defined mutants. A, shown is a graphic representation of gene expression. Red lines indicate genes associated with the T3SS, blue lines indicate transcripts associated with flagella and motility, and gray lines represent other genes. B, shown is a heatmap of gene expression. Gene names are indicated to the right of the heatmap, and experimental conditions (inhibitor or relevant gene deletion or mutation) are indicated below. Coloring of boxes indicates relative expression (green, increased; red, repressed) as indicated on the left. Genes have been grouped according to their function or genetic location in three major classes: motility, pO157, and T3SS.

